

What would we do without our best friends… Not the humankind, the furry kind. It will be crystal clear how much we love them when you read these pet industry statistics.
We spare no expense on our animals! Well, some of us do, but if our pet wants it, we’ll darn sure try to get those Scooby snacks. Leashes and collars and bowls, oh my! We’d rather go hungry than have our kitty go without the latest catnip mistletoe.
Pets are family members, and the numbers show it. We’ll be looking at everything from pet food to the grooming industry to uncover the facts. Do you know how much people are spending on pet-sitting services? Or that giving your pet CBD oil is a thing?
Keep reading to find fascinating facts about pet industry statistics. Just make sure to keep it on the sly so your furry, finned, feathered, or scaly friend doesn’t get a big head.
Top Surprising Stats at a Glance
- In 2025, a total of $158 billion was spent in the U.S.
- 6,405,541 total pets are insured in the US.
- 61% of US pet owners purchase nutritious food for their pets.
- The global pet market industry was valued at $273.42 billion in 2025.
- The value of the pet tech market in 2025 was $15.6 billion.
- 51% of owners buy food and treats for their pets online.
- The global market for natural pet food is valued at $33.6 billion.
- More than 71.6% of US owners have at least one pet.
- Millennials have the highest percentage of pet ownership.
Pet Owners Numbers

People want to make sure their pets are comfortable, and spending money on them is one way to do it.
And our popular pets don’t only consist of cats and dogs. Here is a breakdown of animals and the number of people who own them in the US, according to the latest APPA 2026 survey:
(In millions)
- Bird 5
- Cat 53
- Dog 71
- Horse 2
- Freshwater fish 9
- Saltwater fish 1
- Reptile 6
- Small animal 5
TOTAL American households that own a pet: 95 million U.S households
Now let’s get down to the nitty-gritty and explore the numbers and more about the pet industry.
US Pet Industry Statistics

In 2025, total pet industry sales in the U.S. reached $158 billion (American Pet Products Association, APPA)
And the number continues to increase rapidly. A majority of pet owners see pets as family members and are treated as such.
In 2025, a total of $158 billion in sales was reported in the U.S., which was projected to increase to $165 billion in 2026.
42.4 Billion Are Dedicated to Veterinary Care and Products (APPA)
This growth can be attributed to the increasing demand for high-quality and specialized veterinary care services, including preventive care, diagnostics, and treatments for a wide range of pet health conditions.
| Category | Sales ($ Billions) (projected) | Percentage of Total Sales (%) |
|---|---|---|
| Pet Food & Treats | 69.7 | 42.2% |
| Other Services | 14.9 | 9.0% |
| Vet Care & Product Sales | 42.4 | 25.7% |
| Supplies, Live Animals & OTC Medicine | 35.6 | 21.6% |
| Total | 165.0 | 100% |
In 2022, the US Pet Industry Reached $136.8 Billion. (APPA)

I remember researching this pet industry statistic in 2022, when it reached over $136.8 billion, and thinking, ‘This can’t be right. I need to dig deeper.’ I dug, and it is correct.
In 2024, 6,405,541 total pets were insured in the US. (NAPHIA)
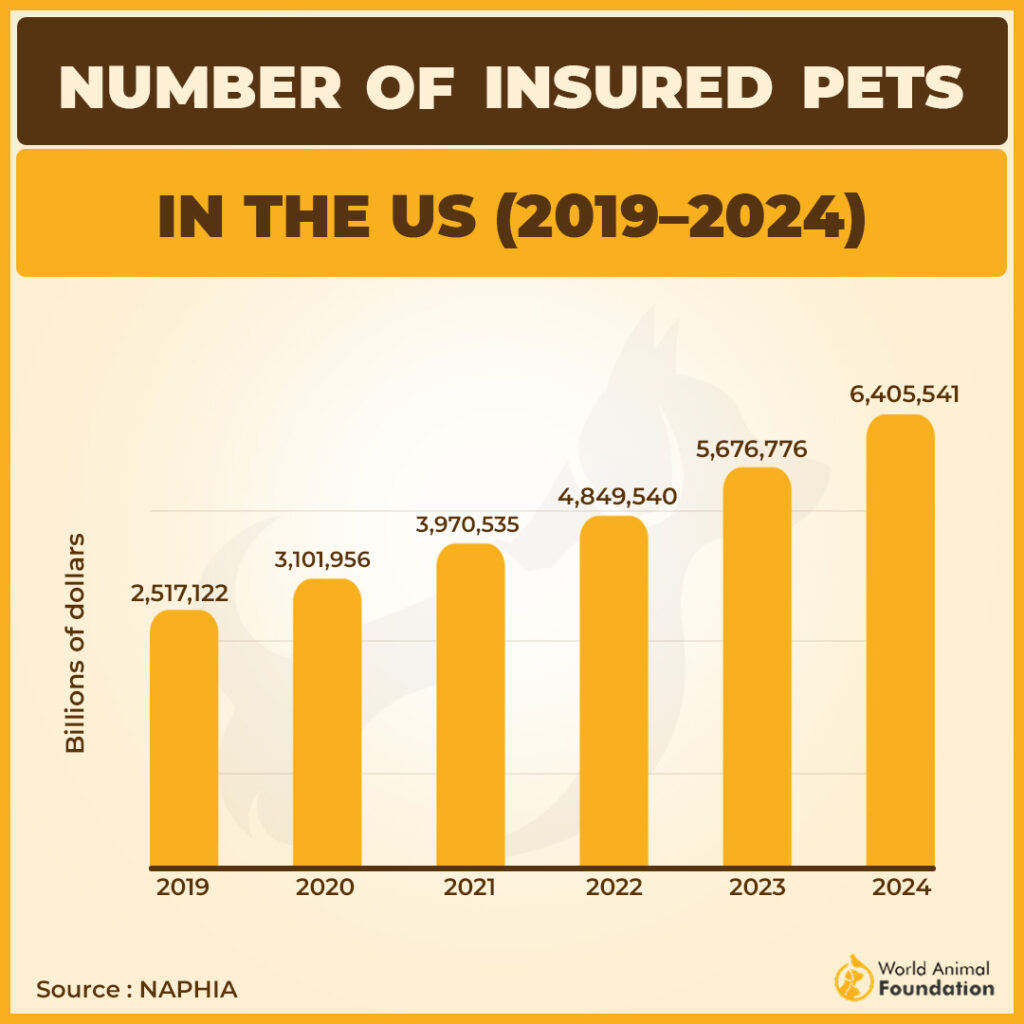
The report shows that 7.03 million pets were insured in North America at the end of 2024 and that the pet health insurance marketplace increased 12.2% from the 6.25 million total pets insured in 2023.
Usually, dogs have a higher percentage of insurance than cats. Cat owners don’t love their kitties any less than dog owners; they just think differently about a cat. ‘Cats can take care of themselves and are less likely to be hurt’ are some thoughts people have about their felines.
61% of US Pet Owners Are Inclined to Purchase Nutritious Food for Their Pets. (Mintel, Kerry Group)
Pet owners worry about what their pets eat. We want them to live long, healthy lives, so buying healthy food for them is usually a priority.
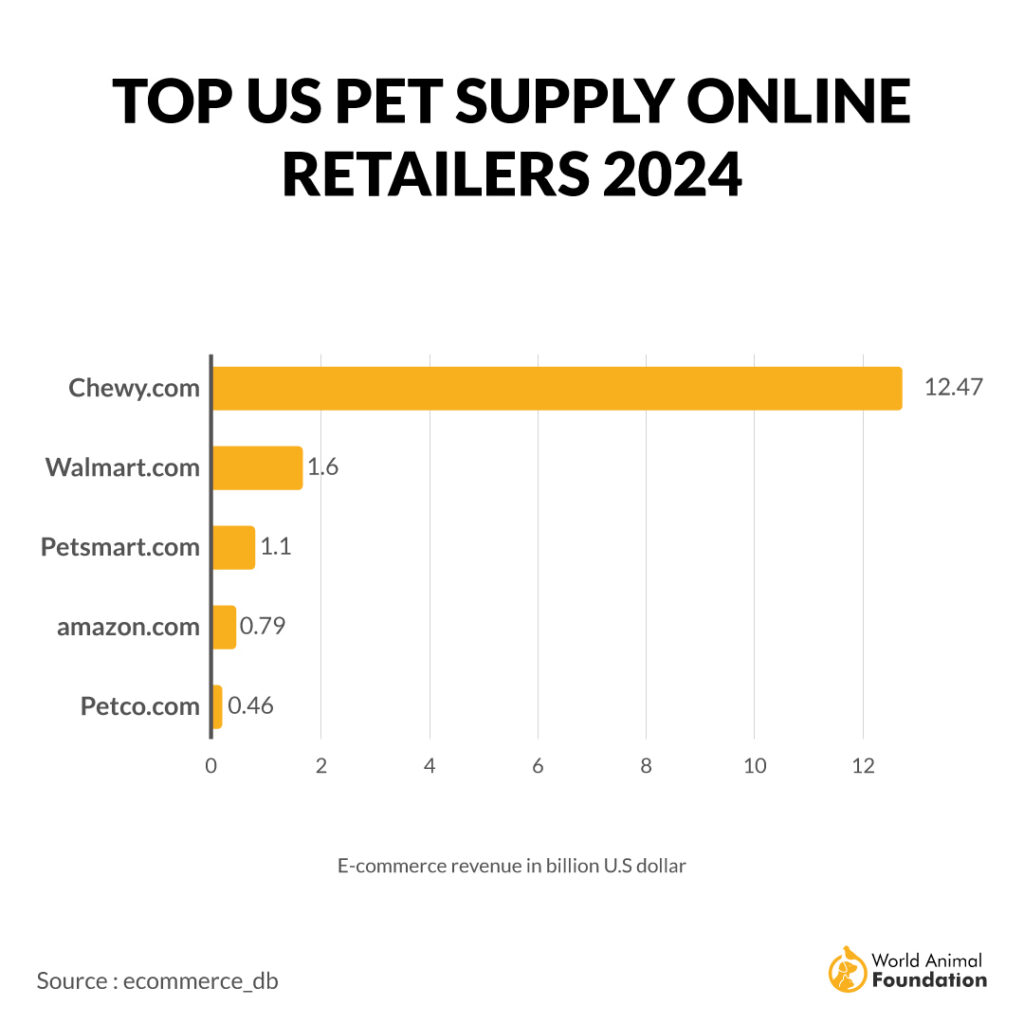
Chewy Leads U.S. Pet Supplies E-Commerce With the Highest Pet Market Sales. (ecommerceDB)
Chewy.com leads the U.S. pet supplies e-commerce with the highest net sales at $12 billion. Walmart was second with $1.6 billion, PetSmart.com came in third with $1.1 billion, and Amazon ranked fourth with $0.79 billion in revenue.
Pet Industry Statistics

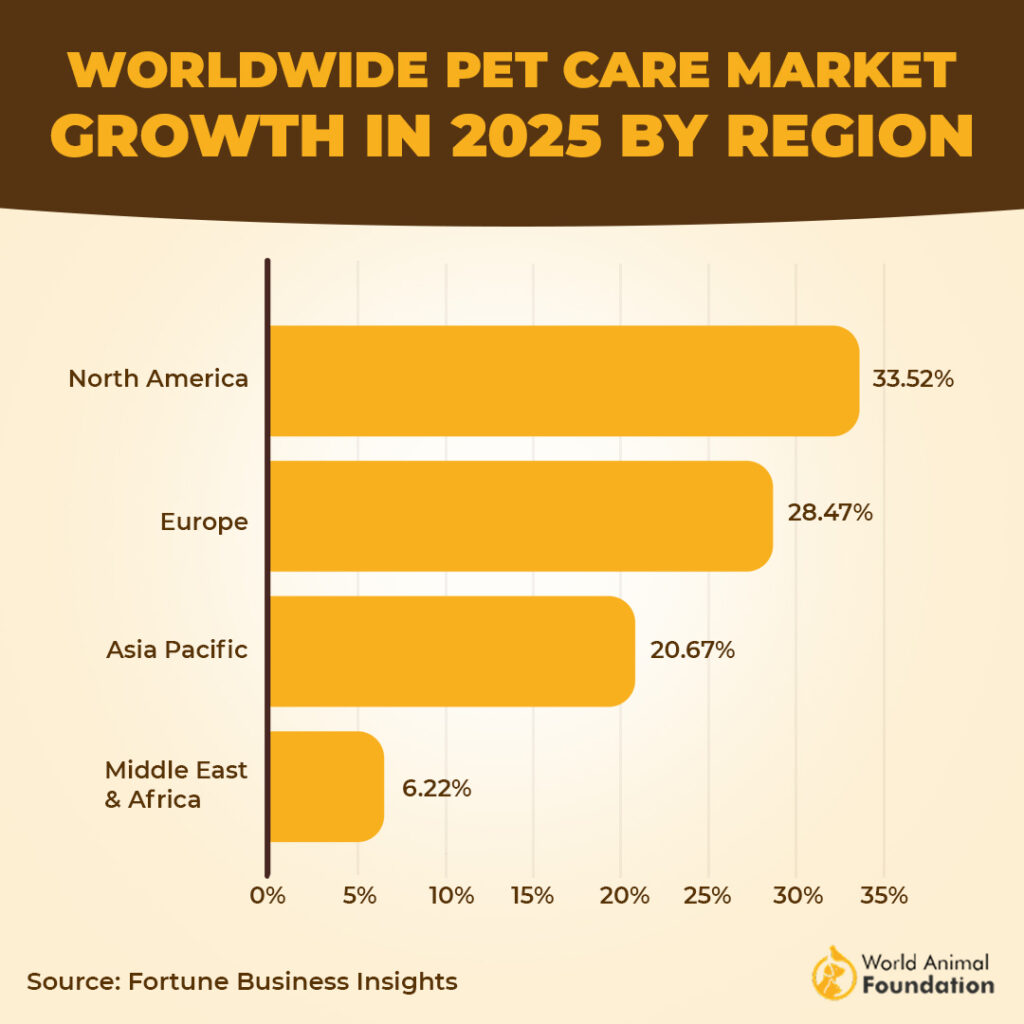
The Global Pet Market Industry was valued at $273.42 Billion in 2025 (Fortune Business Insights, FBI)
According to the FBI Forecast, the global pet care market was valued at $273.42 billion in 2025. Moreover, the FBI asserted that “The increasing knowledge about animal welfare and well-being has led to the growing popularity of pet care products.”
Even in times of poor economies, the pet industry trends don’t seem to notice. It is projected to grow from $289.17 billion in 2026 to $499.06 billion by 2034.
The market in North America reached USD 91.66 billion in 2025, representing 33.52% of total market revenue, and is projected to reach USD 96.67 billion in 2026.
The Pet Insurance Industry valued at $4.61 Billion in 2024 and was projected to rise to $5.21 billion in 2025. (Market Data Forecast)
The pet insurance industry is forecasted to grow to USD 13.77 billion by 2033 from USD 4.61 billion in 2024, according to the Global Pet Insurance Report.
And it was projected to reach $5.21 billion in 2025.
The Global Pet-Sitting Market Size in 2025 Is Expected To Be $4 billion. (Research and Markets)
The global pet-sitting market size in 2024 was $2.9 billion. The pet sitting market is on track to hit $9.7 billion by 2034, growing at a 10.3% annual rate, and covers services like feeding, exercise, and medication for pets.
In 2024, the Market for Pets Other Than Cats and Dogs Reached $3.6 Billion. (Freedonia Group)
Previously, exotic pet products were estimated to be around $3 billion, which in 2024 reached $3.6 billion. If you want a snake, chinchilla, or another wild animal, you’re going to need to spend a significant amount of money. Most require special habitats and lighting, heating/cooling instruments, supplements, dietary needs, and usually a specialty vet.
In 2025, Vet Care Product Sales Generated $41.0 Billion in Revenue. (APPA)

According to 2025 stats, $41.0 billion was spent just on veterinary care. This figure includes veterinary services, pharmaceuticals, and clinic-sold products, representing a 4.02% increase from $39.8 billion in 2024.
During COVID-19, 21% of Pet Owners Spent More Money on Their Pets. (Petfood Industry)
Stats show pet owners have spent either 21% or more on their pets in 2020. Most of us were at home trying to stay safe. We had more time with our pets and could see what they needed.
In 2025, total adoptions reached 4.2 million animals, a 1% increase from 2024. (SAC)
Adoptions remained the primary community outcome, accounting for 67.4% of all outcomes nationwide. Government shelters led in total adoptions, followed by rescues, private animal shelters, and contracted shelters.
It’s anticipated that by the Year 2027, the Global Pet Care Industry Will Cross $358.62 Billion. (Globe Newswire)
Worldwide, North America holds more than 40% of the market share. In 2025, the pet food category was the top performer, holding a 43.2% share.
The Pet Industry has nearly doubled (+74%) from 2018 to 2025. (Petfood Industry)
American pet owners have gradually increased their pet spending each year, leading to a +74% growth over time. According to Petfood Industry, the US pet food market was expected to reach US$158 billion in 2025. This reflects steady growth of about 8.2% per year on average from 2018 to 2025. It is projected to grow by another +4% in 2026, reaching $165B.
Pet Accessories Statistics

The Value of the Pet Tech Market in 2025 Was $15.6 Billion and is expected to increase by 12% CAGR from 2026 to 2035. (Global Market Insights)
As we watch it grow exponentially, there appears to be no ceiling for the pet industry. The market is projected to grow from $19.1 billion in 2026 to $52.9 billion by 2035, reflecting a compound annual growth rate (CAGR) of 12% during the forecast period.
Gen Z pet owners are the most likely to spoil their pets (Forbes)

Gen Z pet owners buy the most gifts for their pets and spend the most per gift. Gen Z pet owners are the most likely to spoil their pets, with 34% buying birthday cakes, 39% purchasing birthday gifts, and 32% spending on clothing or costumes.
Americans spent an estimated $0.7 billion to dress up their pets. (NRF)

Just take a peek at Facebook and Instagram, and this statistic will really make sense. The pet accessory market is booming. Popular pet costume choices include pumpkins, hot dogs, bats, ghosts, and bumblebees.
Annually, Americans spend around 0.7 billion dollars on Halloween costumes for their pets. I think I’ll go dressed as a Cat Lady next year.
Statistics Show That by the Year 2033, the Pet Accessories Market Will Grow by $49 Billion. (IMARC)

Pet owners are increasingly spending more on accessories such as toys, beds, collars, leashes, and clothing to provide their pets with comfort and style.
Tinkerbell must have her tutus and Brutus his studded collar. The global pet accessories market was worth $30.6 billion in 2024 and is expected to grow to $49.0 billion by 2033, with an annual growth rate of 5.38% from 2025 to 2033.
Wearable Pet Tech Is Expected To Generate $13.12 Billion in 2034. (FBI)
The global pet wearable market was valued at $4.16 billion in 2025 and is expected to grow from $4.72 billion in 2026 to $13.12 billion by 2034, with a strong annual growth rate of 13.6%, driven by pet owners’ increasing concern for their pets’ health.
Pet Food Industry
The global natural pet food market size reached USD 33.6 billion in 2025. (IMARC)
According to IMARC Group, the global natural pet food market was worth about USD 33.6 billion in 2025 and is expected to grow to USD 59.4 billion by 2034.
It also reports that the global organic pet food market reached around USD 2.78 billion in 2025.
According to Pet Food Industry Analysis, Both Cat and Dog Owners Spend Around $300 Annually on Food and Treat Sales. (APPA)
This number fluctuates depending on the pet’s particular diet (organic, store-bought, raw, etc.), but this is the average. In a U.S. survey, dog owners reported an average annual spend of $442 on pet food in 2020, while cat owners spent about $329 per year.
In 2024, premium products accounted for 41% of dog food purchases and 38% of cat food purchases. (Pet Food Processing)

Dog and cat owners are inclined to buy premium foods for their pets. America wants to know if their pet is eating the best there is to buy.
In 2024, dog food purchases consisted of 41% premium, 26% generic, and 19% natural products, while cat food purchases were evenly split at 38% premium and 38% generic, with 18% natural options.
Almost 51% of Pet Owners Buy Food and Treats for Their Pets Online. (Pet Food Processing)
There is a boom in buying pet supplies online. Pet food manufacturers made products more accessible, and consumers responded. Fifty-one percent of pet parents bought pet products while online shopping, while 47% made their purchases in physical stores.
The statistic is forecasted to increase. Current pet owners deeply desire to ensure that their pets are fed healthy food, and this statistic proves that this is happening.
In 2022, 53% of Pet Owners Gave Their Pets CBD in the Form of Pet Edibles (Leafreport)
Although the safety of giving your pets CBD oil is still questionable, with some vets and scientists on different sides of the fence, consumers are certainly willing to take the risk anyway. (source)
Millennials account for 53% of U.S. pet CBD buyers. The global pet CBD market is projected to reach $1.7 billion by 2030, growing at 31.8% annually, with dog products leading sales and cat CBD demand rising quickly. (source)
About One-Third of Pet Owners Use CBD Products for Their Pets. (AKC)

About one-third of pet owners in the U.S. use CBD pet products for their pets, particularly treats and shampoo, used to treat anxiety/stress, arthritis/sore joints, or pain.
There Are More than 630 Pet Food Brands (Pet Food Processing)
One trend is that companies look to focus more on food products for different types of pets and the specific needs they have (overweight, age, illnesses, etc.).
In 2020, There Was an Increase in Pet Food Sales in the US by 18%. (Pet Food Industry)
There may not have been an increase in adoptions in 2020, but owners certainly continued to make sure the pets they had and those they added were fed.
The Pet Supplements market size was valued at USD 2.95 billion in 2025. (FBI)
It’s obvious we want to do everything we can so that our pets can live as long as possible.
The global pet supplements market was valued at $2.95 billion in 2025 and is expected to grow to $4.82 billion by 2034 at a CAGR of 6.34%. North America led the market, holding a 43.37% share in 2025.
In North America, the pet supplement industry, worth billions, has traditionally focused on joint, skin, and coat health and is steadily moving from in-store to online retailers.
The Pet Raw Food market size has reached to $4.1 billion in 2025 (TBRC)
A true raw food diet does not completely consist of giving your pet some of your leftover meat. There are extremely important specifics in choosing this type of diet for your pet, and it should involve coming up with a game plan with your veterinarian.
The pet raw food market has experienced rapid growth in recent years and is expected to continue expanding. The market is projected to increase from $4.1 billion in 2025 to $4.55 billion in 2026, reflecting a compound annual growth rate (CAGR) of 11.2%.
Pet Care Market
An Average of $40 to $5,000 Is Spent Yearly by Dog Owners for Dog Grooming. (Chewy)
Grooming is an essential part of a dog’s overall health, and the amount required varies by breed. For dogs needing frequent professional care, grooming costs can reach as much as $5,000 per year.
A significant portion of people choose to groom their pets themselves. They buy brushes, OTC ear medication, shampoo, and the like to do the job.
Americans spend $1,149 on Their Dogs and $1,391 on Their Cats per Year. (ASPCA)
As responsible pet parents, we are obligated to care for our furry friends through both sickness and health. The ASPCA offers several tips to help you save money on your pet’s health care.
Each Dog Grooming Session Costs $79-$136. (Thumbtack)

The average cost of dog grooming is $79-$136, though your final price will typically depend on your dog’s size and coat type. The cost reflects the dedication and skill required to maintain the dog’s cleanliness, health, and overall appearance. My best friend’s dog was just groomed. The cost? Exactly $73.00.
The North American pet market reached $91.66 billion in 2025 (FBI)
North America leads the market, supported by high pet ownership rates and premium product adoption, reaching USD 91.66 billion in 2025.
Pet Care Sales Generated Through E-Commerce Are Predicted To Reach $147.6 billion by 2030 (Mordor Intelligence)
The pet care e-commerce market was worth $102.3 billion in 2025 and is expected to grow to $147.6 billion by 2030, with an annual growth rate of 7.8%. The growth of e-commerce has presented a significant chance for emerging companies to market their innovative products cost-effectively.
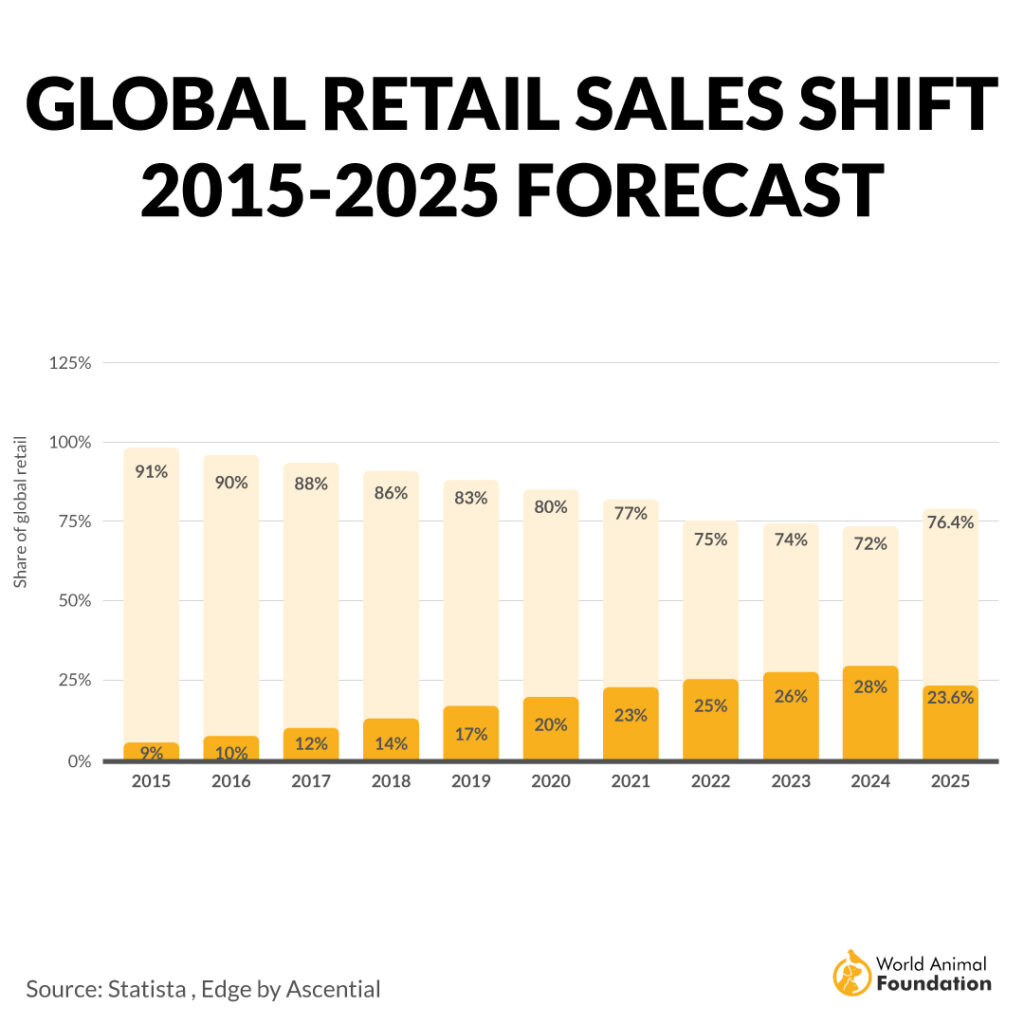
Worldwide retail sales are projected to reach $31.3 trillion in 2025, with global ecommerce sales estimated at $7.4 trillion. Online retail is expected to account for 23.6% of total sales.
The pet grooming industry reached 17,937.3 million by the Year 2025. (FMI)
The pet grooming market is expected to reach $17.9 billion in 2025 and grow to $42.9 billion by 2035, with an annual growth rate of 9.1%.
More pet owners are becoming aware of the importance of maintaining their pets’ hygiene and grooming to ensure their health and well-being.
Pet grooming in America has previously only been a service provided for the wealthy, but has become more commonplace.
Pet Owner Statistics
More than 71.6% of US Owners Have at least one pet. (APPA)

As per the stats of APPA, 71.6% of US owners have at least one pet. ~18% of U.S. households own non-cat or non-dog pets. A pet’s love, loyalty, and devotion can’t be denied, and people recognize it.
During Covid-19, 8% of Adults Adopted Pets. (Pet Food Processing)
This statistic shows that several other age groups were responsible for pet adoption in 2020.
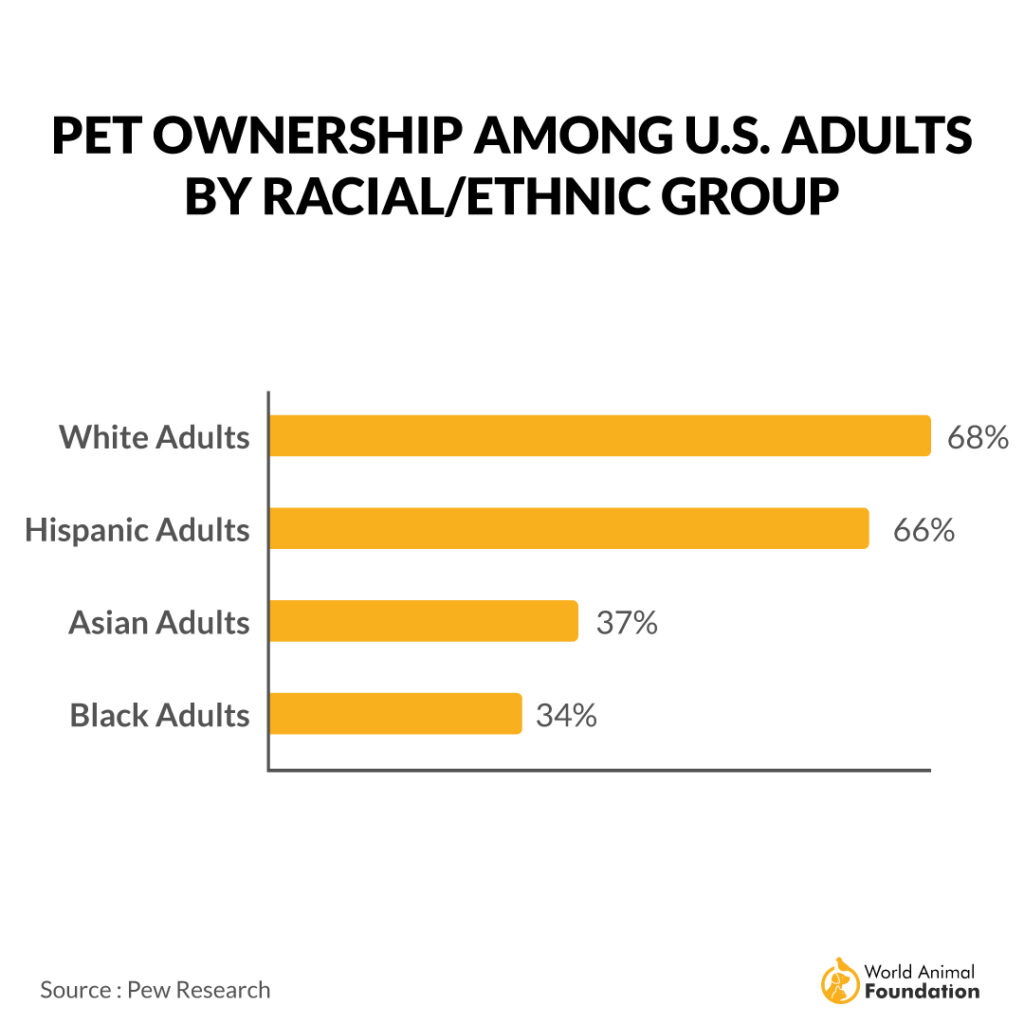
68% of White Adults Own a Pet (Pew Research)
68% of White and 66% of Hispanic adults have pets, while only 37% of Asian and 34% of Black adults are pet owners.
In 2025, U.S. shelters recorded 2 million dog adoptions and 2.2 million cat adoptions. (SAC)
Dog adoptions declined slightly month to month, while cat adoptions remained steady or rose slightly during peak spring and summer months.
Millennial’s Pet Ownership Statistics

By Generation, Millennials have the Highest Percentage of Pet Ownership. (APPA)
Millennials have the highest pet ownership rate compared to other generations. This can be attributed to their delayed marriage and parenthood, higher disposable income, and tendency to view pets as family members.
The children of pet parents (Gen X and Baby Boomers) cranked it up and are at the top of many pet ownership statistics.
| Generation | Percentage |
|---|---|
| Generation Z | 21% |
| Millennial | 30% |
| Generation X | 28% |
| Baby Boomer | 22% |
58% of Millennials Are More Likely To Own Pets Than To Have Children. (Esquire Mag)
Fifty-eight percent of millennials say they would rather have pets than children, and 81% admit they love their pets more than at least one family member. Half even say they would choose their dog over their own mother.
This goes beyond a quirky generational preference—it reflects a broader cultural and socioeconomic shift. This indicates that this generation values their pets as family members more than ever before.
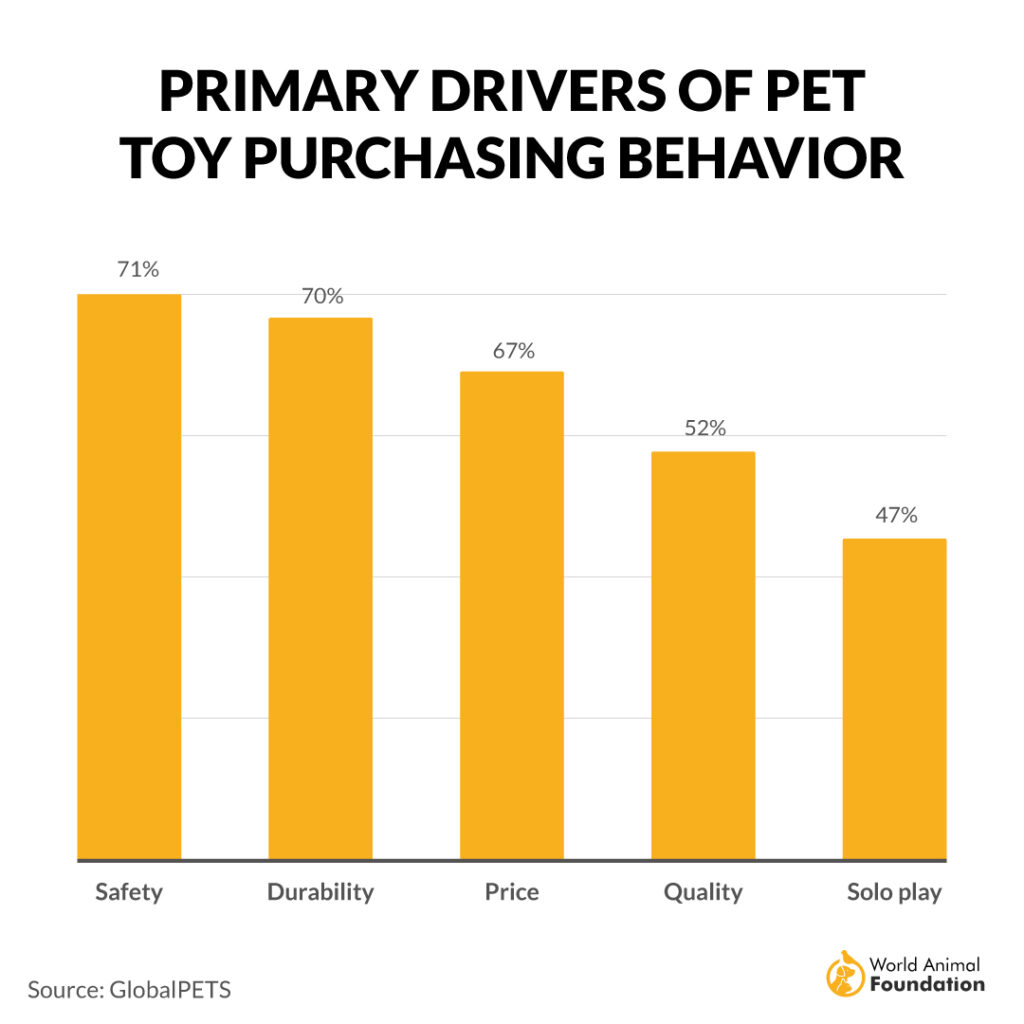
Brand matters more to millennials (8%) than to other age groups, while boomers most often consider product origin (17%). Among Gen Z pet owners, 50% use toys to ease separation anxiety and 48% use them to prevent destructive behavior.
Investment Banking Companies Predict That Millennials Will Increase Pet Ownership. (Morgan Stanley)
Thirty-four (34) percent of 18-34-year-olds plan to get another pet. There’s nowhere to go but up for the pet industry.
13% of Millennials Purchased Organic Foods for Their Dog. ( Pet Food Processing)
Just as the millennial generation seems to be extremely concerned about issues like the environment, they also want their pets to be provided with untreated foods. Thirteen percent of dog-owning Millennials purchased organic dog food, and sixteen percent of cat-owning Millennials purchased organic cat food.
Interesting Facts About the Pet Industry
Here are some more interesting facts about pet industry statistics in the US:
- 24% of Gen Xers — born between 1965 and 1981 — own pets.
- 5.9 million households own a reptile.
- In 2025, pet industry expenditures totaled $158 million.
- Consumer spending is expected to reach 275 billion by 2030.
- 57.2% of California residents will have pets by 2026.
- A vet bill of $999 or less would cause 42% of pet owners to go into debt, while a vet bill of $499 or less would cause 28% of pet owners to go into debt.
- One trend expected to continue moving upward is the humanization of pets. (source)
FAQs
What Is the Most Profitable Pet Business?
You could practically open a pet service entitled “Come see my dog!” and be profitable. But here are nine real-world ideas for you:
- Mobile grooming
- Pet sitting, boarding, and daycare
- Dog and other animal training
- Dog walker
- Pet bakery
- Sell boutique pet toys and supplies
- Pet adoption service
- Pet photographer
- Online pet consulting
How Many People Work in the Pet Industry?
IBIS World reports that 136,378 people are working in the Pet Stores industry in the US in 2023. This is one small group. There are many more hundreds of thousands of people who work in different vocations in the pet industry.
What Is the Most Popular Pet in the World?
The most popular pet in the world is the domestic dog. Dogs are kept as pets in homes around the globe due to their loyalty, companionship, and ability to be trained.
Cats follow closely behind in popularity, valued for their affectionate nature and ease of care. These preferences can vary by region, but globally, dogs and cats dominate as the preferred choices for pets.
How Many People Own a Dog?
In the United States, 86.9 million homes own a pet, and nearly 65.1 million households own a pet dog, highlighting the popularity and widespread ownership of dogs across the country.
How Many Dogs Are in the US?
There are 76,811,305 dogs in the United States, indicating a significant canine population across the country.
Which Product Do Pet Owners Spend Most of Their Money On?
It’s pet food, by far, and here is the entire list:
- Pet Food and Treats $67.8 billion
- Supplies, Live Animals & OTC Medicine $34.3 billion
- Vet Care & Product Sales $41.4 billion
- Other Services $13.5 billion
In conclusion
We’d be sick as a dog with hairballs if we didn’t have our pets. Every US generation has them, adores them, and will continue to spend as much as it takes to keep them happy.
You’re not alone as you buy that next dog toy or that new cat food; that’s everything. You’re in fine company. And only pet lovers will understand… they’re so worth it. Pets give us laughter, loyalty, and love, and will never be undervalued. The pet industry experts agree.
And if you can figure out what catnip mistletoe is, let me know!