

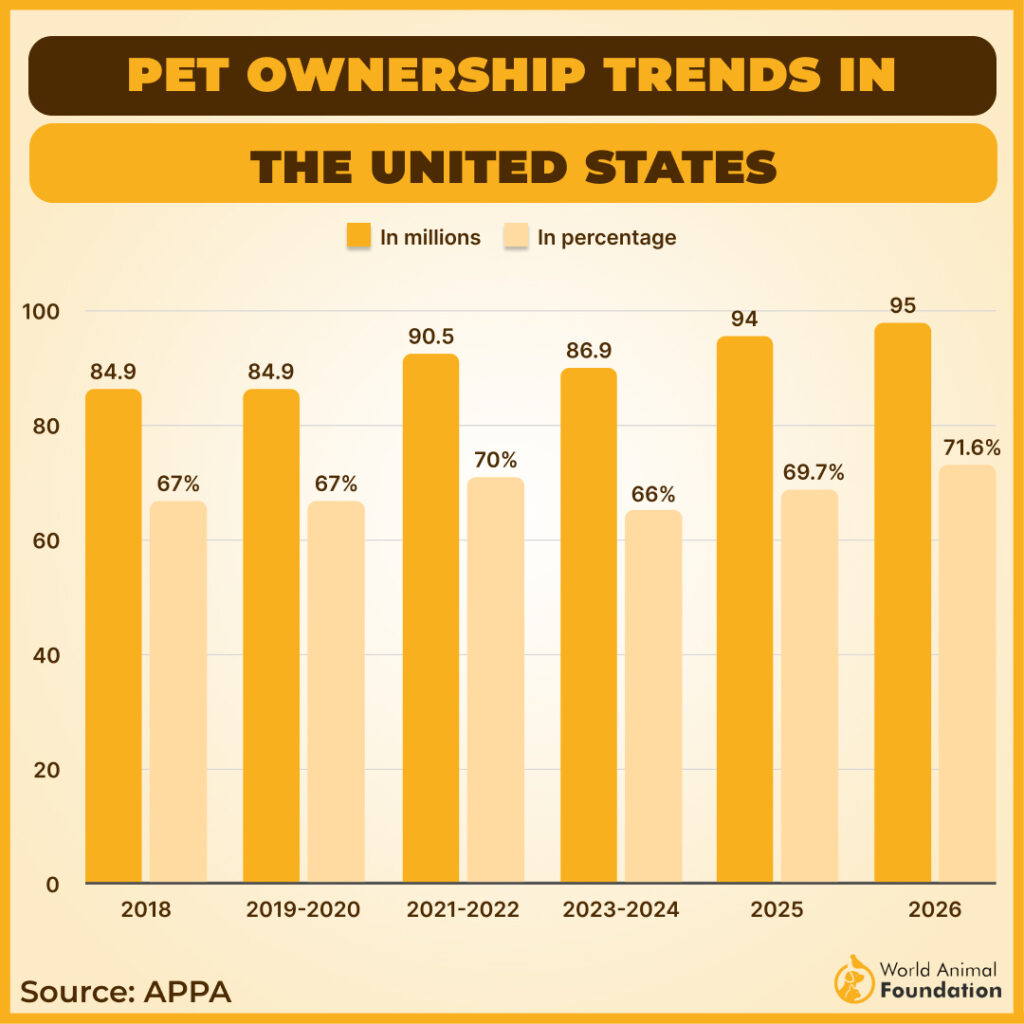
In 2026, pet ownership remains a cornerstone of American life, as per APPA’s Industry Report, 95 million U.S. households own a pet, accounting for 71.6% of all households.
Despite a slight dip from the peak in 2020, this figure represented a significant rise from the 56% recorded in 1988, the inaugural year of tracking pet ownership trends. Dogs have clinched the top spot in America’s heart, being the preferred companion in millions of households, overshadowing cats.
This enduring love for pets is mirrored in the pet industry’s financial health, which has seen consistent growth in line with the expanding number of pet-owning households.
This blend of companionship and economic impact highlights the integral role pets play in shaping domestic and economic landscapes.
Key Stats at a Glance
- 95 million U.S. households own a pet
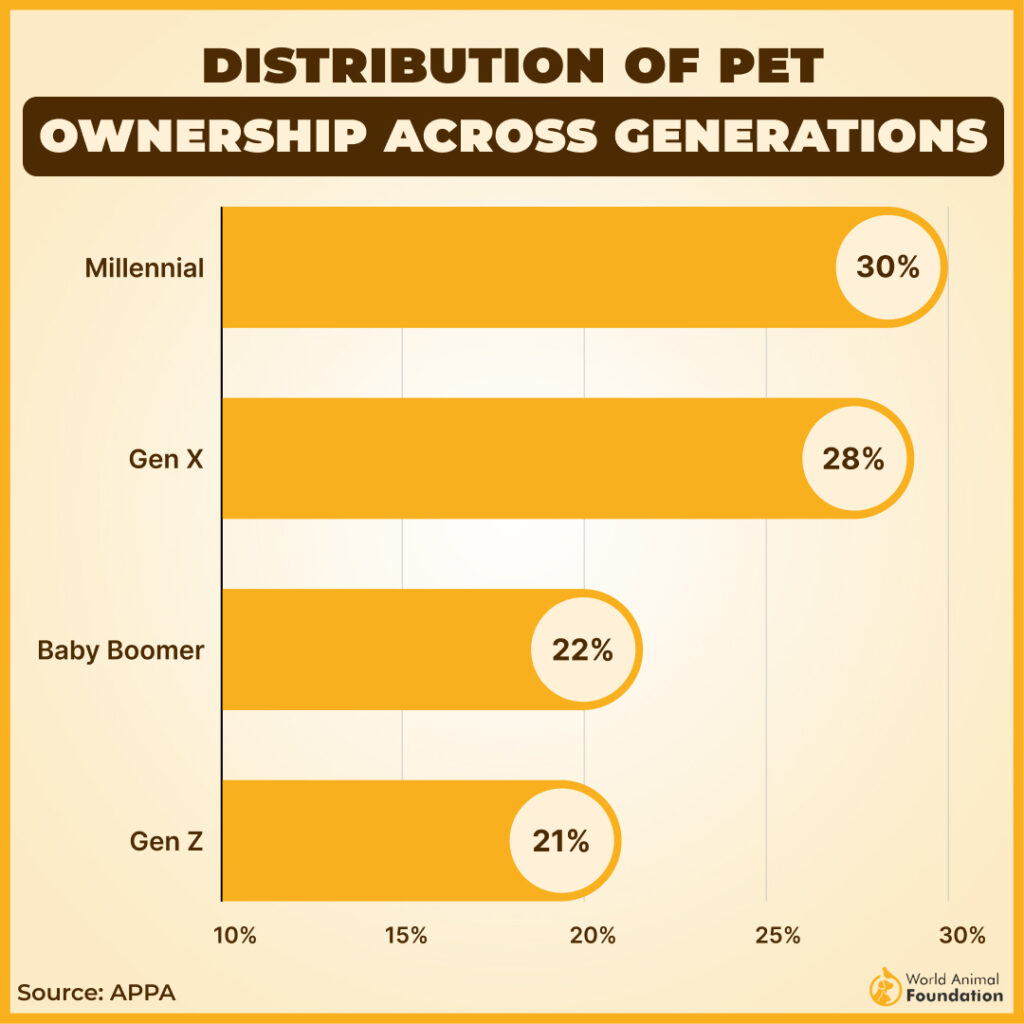
- Millennials make up the largest percentage of current pet owners (30%)
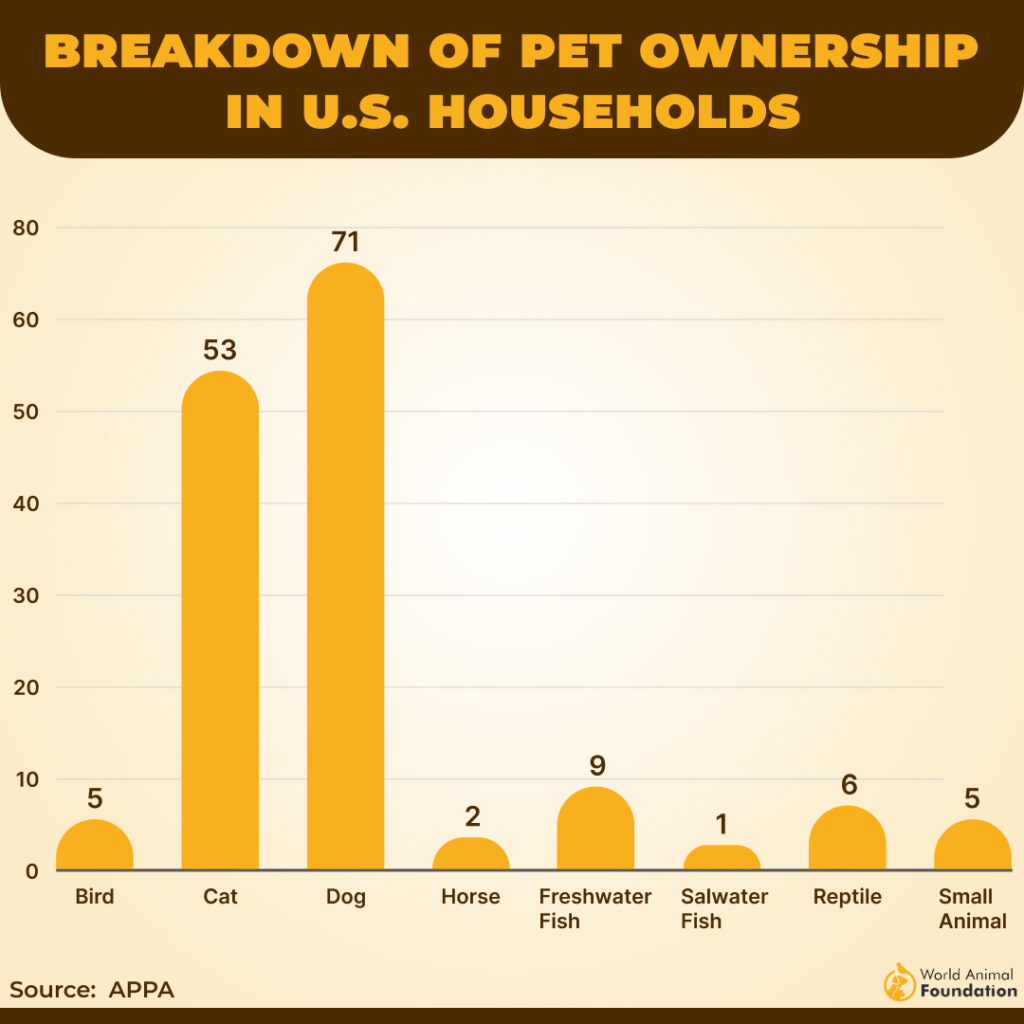
- Dogs dominated 71 million homes; cats were in 53 million
- Around 15.5 million dogs and 13 million cats are kept as pets in the UK
- In 2025, US citizens spent 158 billion dollars on their pets
- The initial year of pet ownership can cost up to $1,030
- Almost 1 in 10 U.S. families owns an exotic animal as a pet
Pet Ownership Statistics
- As per the latest American Pet Products Association 2026 stats, 95 million U.S. households (71.6%) own a pet, while 86.9 million U.S. households—about two-thirds or 66% of the population—owned a pet in 2023–2024. We can witness an upward trend, as 70% of U.S. households (90.5 million homes) owned a pet in 2022.
- So we can confidently say that pet ownership is on the rise, with 71 million U.S. dog owning households and roughly 53 million households owning a cat, securing their place as the second most common companion animal.

| Animal | Number in Millions |
|---|---|
| Bird | 5 |
| Cat | 53 |
| Dog | 71 |
| Horse | 2 |
| Freshwater Fish | 9 |
| Saltwater Fish | 1 |
| Reptile | 6 |
| Small Animal | 5 |
- Approximately 1 in 5 U.S. households acquired a dog or cat from March 2020 to May 2021. Many adopted their canines from a friend, some purchased from pet stores, and a few took them in as strays. The pandemic affected everyone, and Americans added fur babies to compensate for losing social contact.
- According to ASPCA, almost 40% of dog owners and 46% of cat owners got their pets from word of mouth. U.S. households get dogs and kitties from these sources:
- Shelters 23% and 31%
- Friends/Family 20% and 28%
- Breeders 34% and 3%
- Stray pets 6% and 27%
- Private 12% and 6%
- Other sources, 32% and 39%
- Homeowners tend to have pets more often than renters: 58% own dogs, and 36% own cats, compared to renters’ 39% and 29%.
- The Shelter Animal Count (SAC) says that 40% of dog adoptions and 44% of cat adoptions were through government shelters, and 77% of dog adoptions and 72% of cat adoptions came from rescue organizations.
- According to the AVMA, 23% of dog owners acquired their dogs from breeders, while only 7% of cat owners did.
- Compared to 6% of pet dogs, 27% of pet cats were once strays, according to ASPCA.
- 25% of cats in the U.S. were received from family, friends, or relatives.
- According to stats from 2016, 85% of dog owners and 76% of cat owners consider their pet to be a human family member.
Pet Ownership By Generation
Millennials take pet parenting seriously and are the largest consumers of pet care. Millennials, across all age groups, treat their fur families like an extension of the human family. Morgan Stanley says this trend will continue.
However, Baby Boomers, with 22% of the pie, probably taught the following generations about pet ownership.
- Millennials are the biggest group of pet owners, making up 30%. Gen X makes up 28%, Gen Z is 21%, and Baby Boomers make up 22%.
- In 2024, Gen Z accounted for 20% (18.8 million) of U.S. pet-owning households—a 43.5% increase from 2023. This generation also drove notable growth in both dog and cat ownership, representing 20% of dog owners (an 18% increase) and 20% of cat owners (a 25% increase) year-over-year. Notably, 70% of Gen Z pet owners have two or more pets, making them the generation most likely to own multiple animals and showing a strong upward trend in pet companionship.
Most Famous Pets in the US

According to APPA, Americans favor canines over kittens annually and even buy pet insurance based on that principle. Many pet-owning households have one dog or more, while others find felines are the cat’s meow!
- The number of households owning at least one dog is 71 million, according to the APPA survey.
- 2 million Americans have a horse pet, while 1 million have saltwater fish. According to the earlier APPA study, 2.2 million American households owned a horse, and 2.2 million owned a saltwater fish.
- In the latest AVMA study, dogs were found to be owned by 42.6% of households in the United States, while 32.6% were cat-owning households. The number of pet dogs was estimated to be around 70 million in the 2021-2022 study, which showed a slight decrease in 2023.
- From 2016 to 2022, the number of U.S. households owning dogs rose by 6.1%, reaching 45% from 38%. During the same period, cat ownership increased by 4%, from 25% to 29%.
UK Pet Ownership Statistics

- 15.5 million U.K. households (41%) owned a pet dog. There were 13 million U.K. households, according to the old study.
- There are 13 million owned pet cats in the U.K. households, which is about 31%.
| Pet | Number | Percentage |
| Dogs | 15.5 million | 41% |
| Cats | 13 million | 31% |
| Indoor Birds | 1.4 million | 2.7% |
| Domestic Fowl | 900,000 | 1.1% |
| Rabbits | 500,000 | 1.2% |
| Horses & Ponies | 600,000 | 1.0% |
| Guinea Pigs | 500,000 | 0.7% |
| Pigeons | 500,000 | 0.7% |
| Snakes | 500,000 | 0.8% |
- The U.K. has the highest pet reptile population, 2.4 million, whereas Russia has the second largest (1.1 million), according to EPFI.
Pets Around the World

- Almost 373 million cats and 471 million dogs are owned as pets worldwide.
- Russia has the world’s highest rate of cat ownership at 59%.
- 139 million European households (49%) own one or more of Europe’s 299 million pets, as per FEDIAF.
- Europe is home to 352 million pets, with 129 million cats and 106 million dogs, according to EPFI.
| Pet Type | Number in Millions |
| Cats | 129 |
| Dogs | 106 |
| Birds | 52 |
| Small Mammals | 30 |
| Aquaria | 23 |
| Terraria | 12 |
| Total Pets | 352 |
- In 2023, Brazil had more than 160 million pets. Out of these, over 62 million were dogs. Birds were the second most popular pet, with 42.8 million living in homes across the country.Brazil has more pets than any other country in Latin America, including birds, which are the second most popular pets after dogs. Assume veterinarians aren’t busy with spaying and neutering.
| Pet Type | Number of Pets (in millions) |
|---|---|
| Total Pets | Over 160 |
| Dogs | More than 62 |
| Birds | 42.8 |
- In 2023, Italians had about 30 million pet fish, making them the most common pets in the country. They also had more than 10 million cats and around 9 million dogs at home.However, what’s surprising is the 13 million bird population; let’s take a look at other pet numbers in Italy:
| Pet Type | Number of Pets (Approx.) |
|---|---|
| Fish | 30,000,000 |
| Birds | 13,000,000 |
| Cats | 10,000,000+ |
| Dogs | 9,000,000 |
- In 2023, dogs were the most popular pets in Spain, with more than nine million living in homes. Cats came next with 5.6 million, followed by ornamental birds.Birds are part of the massive live animal purchases in Spain’s pet-owning households. Bird breeds vary, but the mean number is 5 million.
| Pet Type | Number of Pets (in millions) |
|---|---|
| Dogs | Over 9 |
| Cats | 5.6 |
| Ornamental Birds | 5 |
Not that there is competition, but Turkey kept more pet birds than even Spain when the EPFI conducted its population category survey.
- As per the EPFI study, Turkey has the second-largest ornamental bird pet ownership (11.2 million) in Europe.
- According to EPFI, France has twice the number of pet cats (15 million) than pet dogs (7.6 million).
- Romania has the highest percentage (48%) of households with pet cats in Europe. About half or more than half of homes have cats, as per EPFI.
- FEDIAF states that in Poland, 8,440,000 households own pet dogs
- In Asia Pacific countries (APAC), 32% of households own a dog compared to 26% that own a cat. Data suggests K-9s rule the roost in Asia-Pacific countries, with 32% over 26% of kitty owners. To put these percentages into perspective, Asia-Pacific means high-density populations like China, Japan, the Philippines, South and North Korea, Pakistan, India, Bangladesh, and others.
| Country | Dog Ownership Percentage | Cat Ownership Percentage | Goldfish Ownership Percentage |
|---|---|---|---|
| Hong Kong | 16% | 14% | 7% |
| Thailand | 47% | 42% | 7% |
| Philippines | 67% | 43% | 7% |
| Indonesia | 10% | 47% | 11% |
| Malaysia | 20% | 34% | 5% |
| Vietnam | 53% | 35% | 15% |
| Average | 32% | 26% | 15% |
- According to stats from 2020, 64% of households in New Zealand own a pet. New Zealand has no native mammals other than bats and marine mammals.
- According to the AMA, the number of pets in Australia is higher than the population, i.e., 29 million vs. 27 million. Who knew there were more pets down under than Aussies? Does that mean people are companion animals to felines and canines?
Aussies don’t keep kangaroos or koalas (it’s illegal). However, they share their homes with pets at 61-69% ownership. Let’s look at their pet numbers:
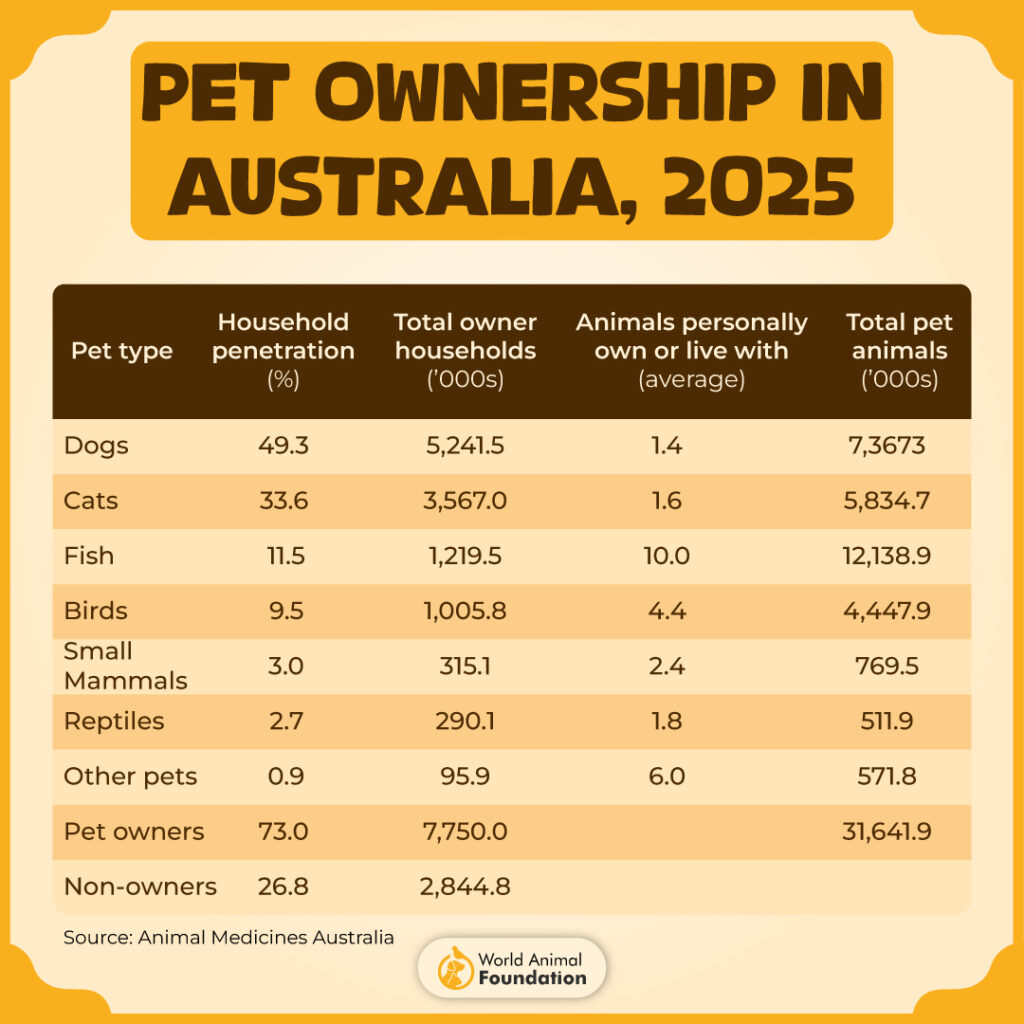
Australia’s pet population is estimated at 31,641,900 animals, with 7.75 million households owning a pet today.
- Almost 49.3% of households in Australia own at least one dog, followed by 33.6% cats, 11.5% fish, and 9.5% birds. A national survey of people and pets in Australia lists dogs as the pet owners’ choice.
Pet Industry Expenditures Statistics

Pet ownership is difficult to gauge, but pet ownership statistics explain how we spend our money. American pet owners spend generously.
The lucrative American pet care industry reached a staggering $123.6 billion in 2021, an increase of 19%. Although inflation stagnates in other consumer goods areas, it’s not affecting pet products.
The State of the Industry data for 2022 showcased remarkable growth in every category, with total sales reaching an impressive $136.8 billion, reflecting a significant 10.8% increase compared to 2021.
The substantial increase in spending can largely be attributed to higher-than-anticipated inflation rates, and we can say that spending will continue on a similar trajectory, remaining steady throughout 2023.
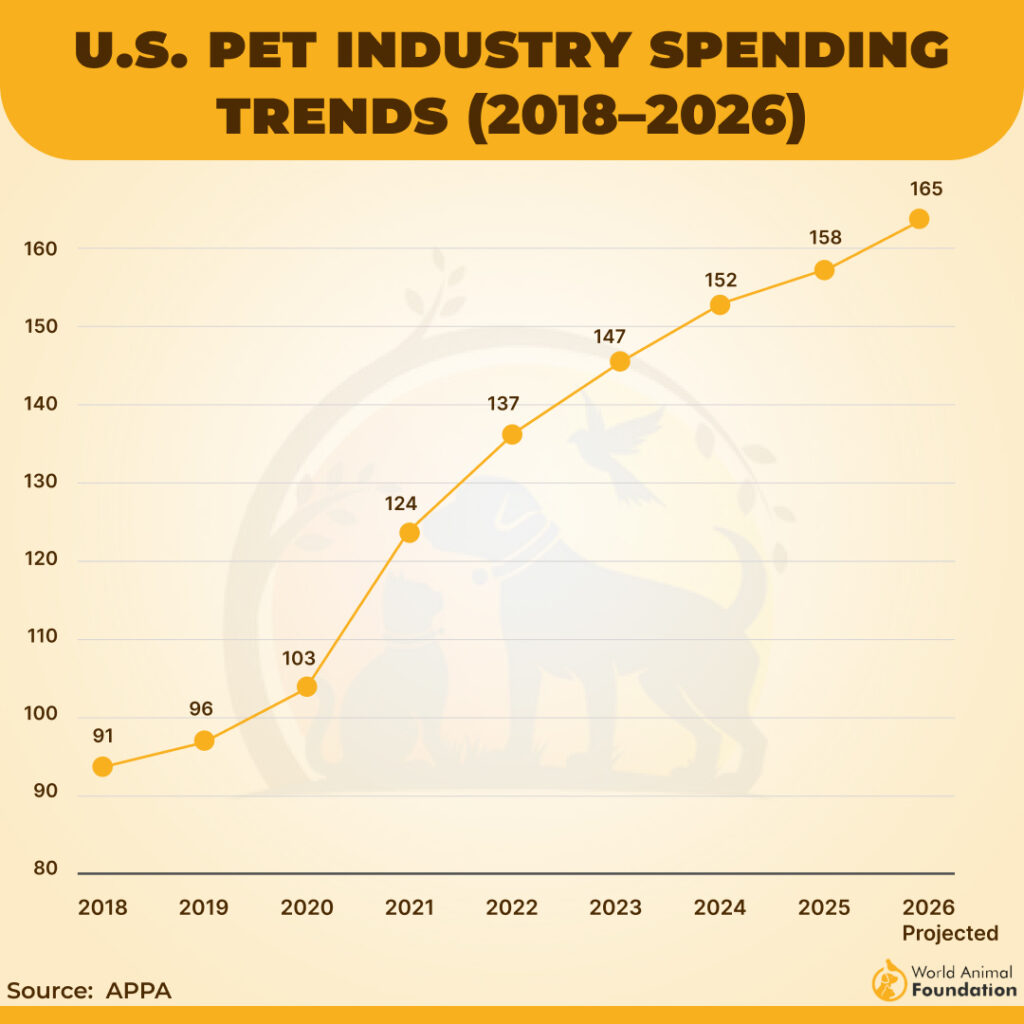
In 2025, US citizens spent 158 billion dollars and are projected to spend 165 billion dollars in 2026 on their pets. According to APPA:
- In 2026, projected pet food sales and treats were estimated at $69.7 billion, compared to $68.3 billion in 2025.
- Pet supplies, live animals, and over-the-counter medicine are expected to generate $35.6 billion in sales.
- Veterinary care and product sales are projected to reach $42.4 billion.
- Other services are anticipated to contribute $14.9 billion.
- III states that the expenditure of the U.S. pet industry expanded by 114% from 2010 to 2020.
- 2019 stats reveal a dramatic increase in pet ownership in the U.S. from 56% in 1988 to 67% in 2019.
- III stated that the U.S. pet industry earned $123.6 billion in 2021 as compared to $103.6 billion in 2020.
- Between 2020 and 2021, the U.S. pet industry spending grew by 19%, as per III.
- From 2022 to 2023, the expenditure on services excluding vet care increased by 7.89% ($12.3 billion) as per APPA. Pet owners spent more on services and veterinarian care. Industry experts look to millennials as a leading factor. Since they’re delaying families or having smaller families, they can afford to spend more on pet care and specialized pet food.
- By the year 2035, the world pet toy market will surpass $8.6 billion. The trend to humanize pets and shower them with gifts drives pet toy sales. Pet owners also spend generously to buy their pets higher-quality toys and accessories.
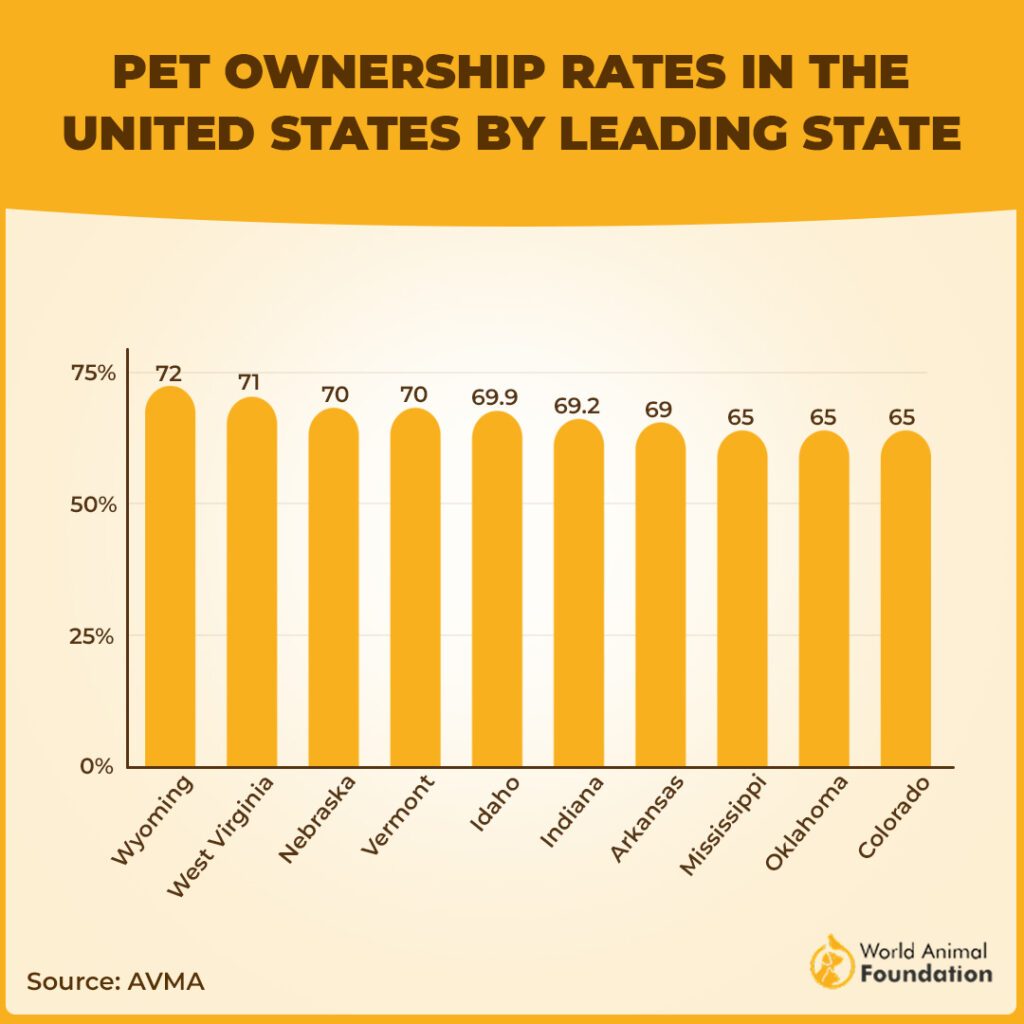
- Even before the pandemic hit, the average number of pet-owning households increased as data was collected from each survey participant to gauge the pet population in each state. After the pandemic, pet ownership surged even further, with Wyoming taking the lead.
Annual Expenditure on Dogs and Cats

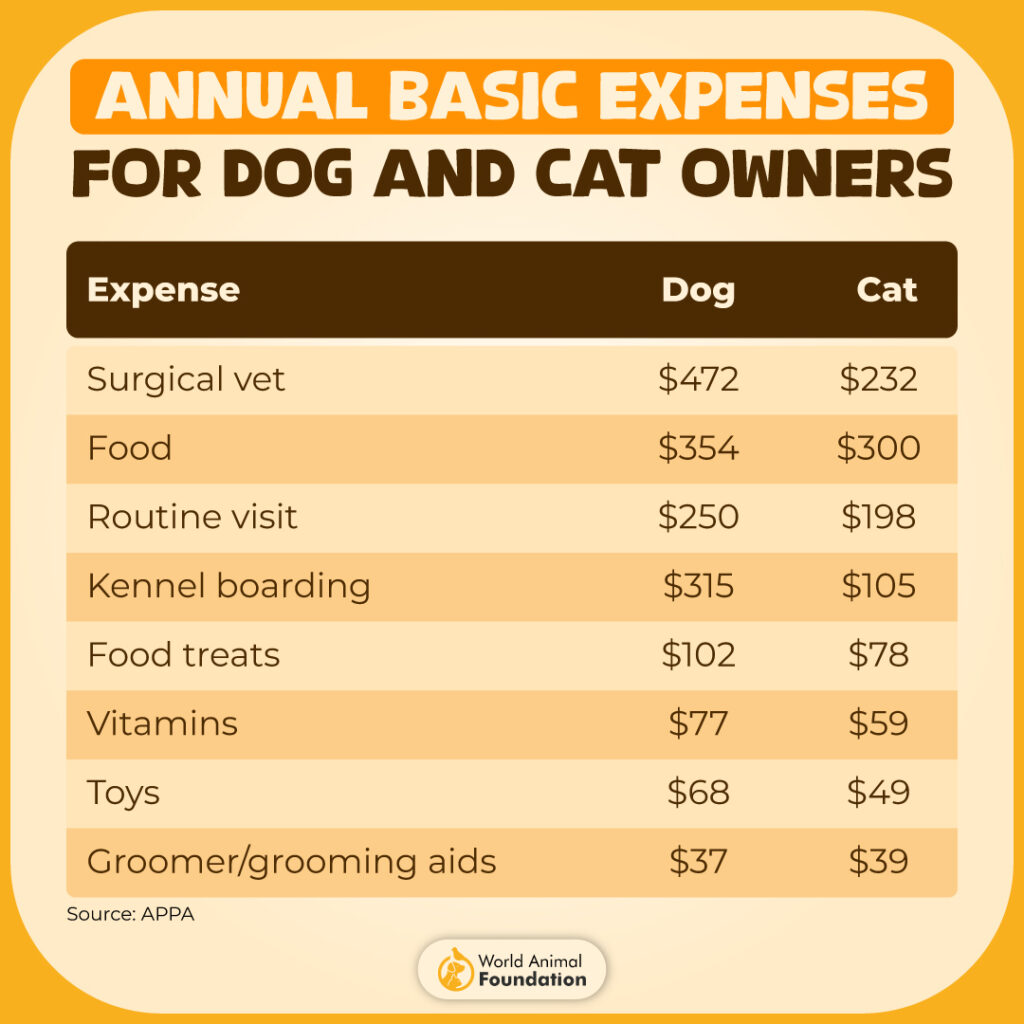
- For dogs, annual surgical vet visits cost $472, routine vet visits cost $250, and food expenses are $354, according to III. For cats, annual surgical vet bills cost $232, routine vet visits cost $198, and food expenses are $300.
Dog Owners vs. Cat Owners Statistics By State

- Idaho has the highest dog ownership rate in the country, at 58.3%.
| State | Pet ownership | Dog ownership | Cat ownership |
| Idaho | 69.9% | 58.3% | 33.3% |
| Pennsylvania | 60.6% | 38.9% | 28.9% |
| Oklahoma | 65% | 47.7% | 28.4% |
| Vermont | 70% | 28.3% | 44.6% |
| Tennessee | 61.7% | 47% | 30.9% |
| South Dakota | 46.4% | 32.1% | 26.6% |
| Ohio | 62.4% | 37.9% | 30.7% |
| Maryland | 48.6% | 30.2% | 18.6% |
| California | 57.2% | 40.1% | 22.9% |
| Texas | 58.2% | 43.4% | 20.5% |
| Florida | 56% | 39.8% | 24.2% |
| Indiana | 69.2% | 49.4% | 37.5% |
| Oregon | 59.2% | 37.8% | 30% |
- In the United States, there are about 14,000 animal shelters and rescue groups dedicated to animals.
- In 2025, U.S. shelters and adoptions reached 4.2M animals, increasing by 29,000 (+0.7% more), as per SAC.
Exotic Animals
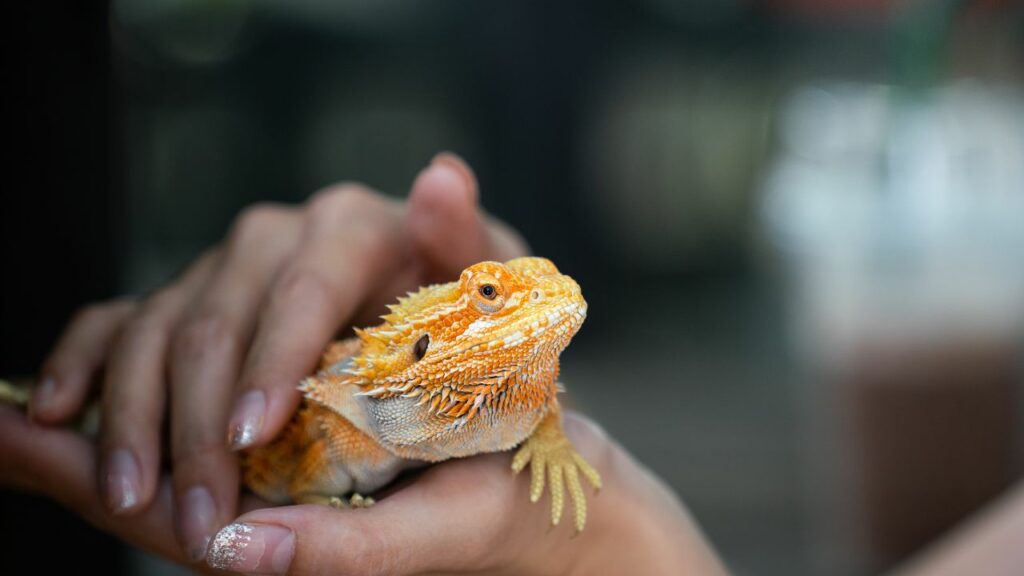
- The U.S. has more than 17 million exotic animals.
- The U.S. has almost 5,000 captive tigers, and over 8,000 tigers are kept in breeding facilities across Asia.
- Almost 1 in 10 U.S. families owns an exotic animal as a pet.
- The most famous exotic animal in the U.S. is the capybara.
- 19 states have comprehensive bans regarding exotic animals in place.
Pet Insurance Statistics

- Almost $48.78 is the monthly insurance for dogs. Updated figures for average pet care insurance for dogs are $30-$200 monthly. The cost can be higher for mature or large dogs.
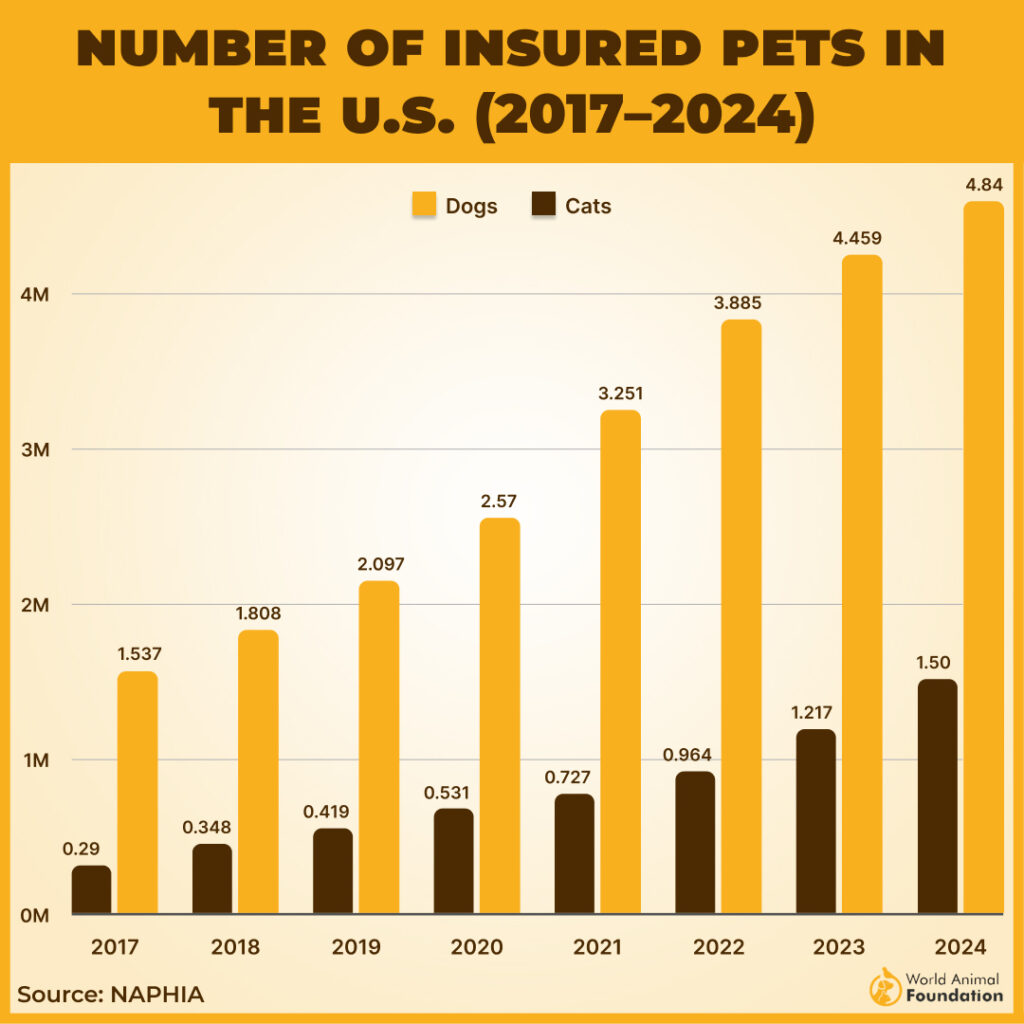
- In 2023, total insured pets in the U.S. saw a growth of 21.9%.
- Recent research shows that 89% of dog owners overestimate the cost of pet insurance.
- NAPHIA states that in 2024, approximately 6.4 million pets in the U.S. were insured, representing nearly 10% of the national pet population, with dogs making up the majority of covered animals.
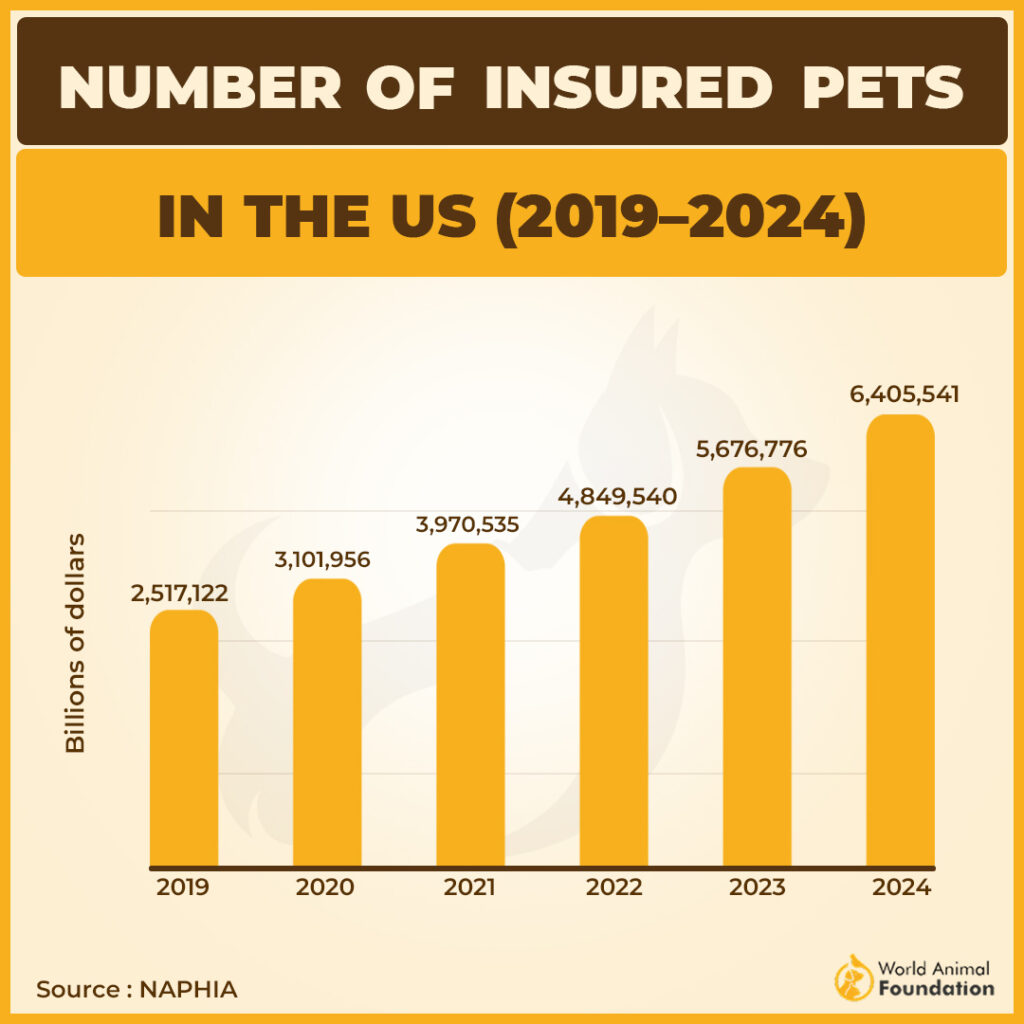
- At the end of 2024, U.S. pet insurance premiums reached up to $4.7 billion.
- In 2023, U.S. citizens spent around $3.610 billion on combined insurance, which included accident & illness and insurance with embedded wellness, as noted by NAPHIA.
- According to the NAPHIA, more dogs are insured than cats in the U.S.
Pet Insurance Statistics by state prove that California takes pet ownership to heart and leads with the most insurance investments. In addition, several states take pet insurance as seriously as pet products.
- California 18.3%
- New York 7.5%
- Florida 6.2%
Interesting Stats
- Almost 6% of pet animals board a plane in the U.S. every year. Americans don’t like to leave home without their furry family, and 6% or roughly 2 million pets travel by plane. A third of pet parents would rather stay home than travel alone.
- According to the 2025 SAC Report, U.S. shelters are on pace to receive about 5.8 million dogs and cats, a decrease of 121,000 animals (2%) compared to 2024. Shelters work at full capacity. U.S. shelters in 2025 are projected to receive about 2.8 million dogs and 3.0 million cats. The declining number of animals entering the system since 2011 is a good sign!
- Almost 60% of pet owners in the U.S. are female. Wealthy American women change the pet-owning households data. Pet-owning households for women top out with significant household incomes (over $220,000), and 77% of those are 50 years old. Infogroup studied a total of 50,000 survey participants and their spending habits.
- The U.S. has almost 30–40 million community cats. The U.S. has a concern for cats annually overpopulating and estimates that as many as 30-40 million felines live homeless among us. These are community cats, though many still use feral or alley cats. You’d be overwhelmed to know how many cats are in the USA!
- People care about their pets and invest in good veterinary care. Over 118,624 vets were licensed in 2020, which increased to 127,131 in 2023.
- As per AVMA, the estimated total number of U.S. veterinarians is 133,475. Interestingly enough, female veterinarians outnumber males. The number of female vets is 91,889, the number of males is 40,595, and the number of nonbinary vets is 206.
- On average, 59% of dogs are obese. Obesity is a problem in America and affects adult dogs who are feasting on premium food and treats. Insured pets may not qualify for pet insurance if it’s a pre-existing condition.
FAQ
How Many Cats Are in the United States?
The latest AVMA statistics reveal that the USA is home to an estimated 60.2-62 million pet cats, highlighting their significant presence nationwide. In the U.S., cats reign over about 45 million households.
How Many People Own Cats?
About 90 million people own a pet. According to APPA, approximately 46.5 million pet-owning households in the US had a cat.
How Many People Have a Dog?
According to data provided by APPA in 2024, 65.1 million households in the US owned a dog, underscoring its popularity as a pet. In 2022, dogs were found to be owned by 44.5% of households in the United States, while cats were owned by 29% of households. There are about 24 million pet dogs and cats in the UK.
The number of pet dogs was estimated to be around 69 million to 70 million in the 2021-2022 study, which showed a slight decrease in 2023.
Are There More Cats or Dogs in the World?
Currently, there are about 900 million dogs globally, with 470 million as pets, and around 600 million cats, with 370 million kept as pets.
Final Thought
The world of pet ownership is a fascinating tapestry, reflecting not just numbers but the deep bond between humans and other animals. These statistics aren’t just figures; they represent the millions of stories, moments of joy, and unparalleled companionship that multiple pets bring into our lives.
As pet owner numbers show a steady rise, it’s clear that welcoming a new pet into your life is not only a smart way to find emotional support, but it’s also becoming more common among adults living independently.
From the comforting presence of emotional support animals to the tranquility of freshwater fish, these statistics reveal that nearly one-third of households have found joy and companionship in the form of a furry or finned friend, making pet culture a growing and heartwarming trend!