

Blame it on the global pandemic or any media influence, but pet spending and the idea that pets are family members drive pet ownership to record highs.
There’s a reason the pet food industry and pet insurance market are regular topics discussed on Fortune Business Insights. U.S. pet owners indulge their pets not just with premium food but with expensive services.
To understand pet ownership statistics and how they can influence ownership spending, here is the data that suggests our pets are consuming more of our time and money. They already possess all of our hearts!
Most Important Stats to Know
- In 2025, U.S. Citizens Spent $158 Billion on Their Pets
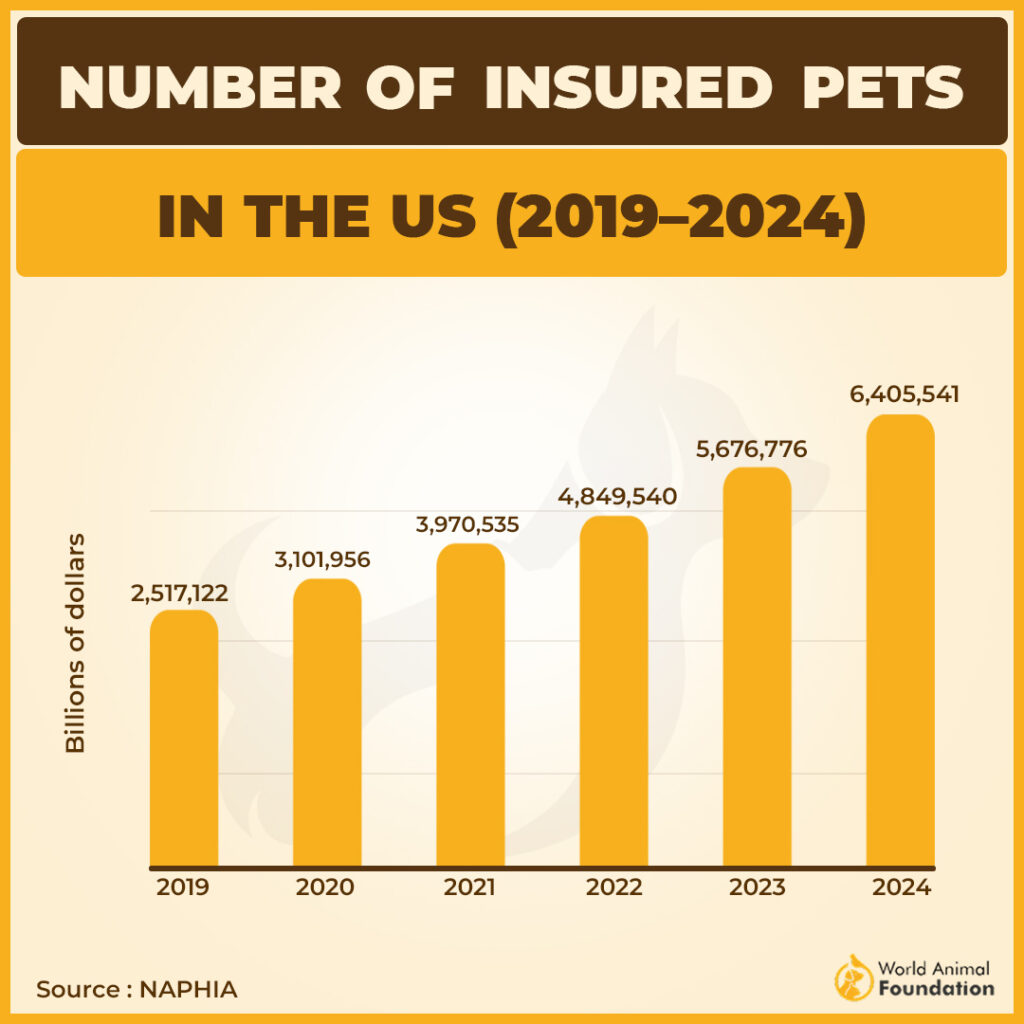
- The Number of Insured Pets in the U.S. was approx 6.4 million in 2024
- Black Americans Spend $218/year on Their Pets
- Dog Owners Spend $912, and Cat Owners Spend $653 Annually
- The Pet Care Market was worth $273.42 Billion in 2025
- 30% of Millennials Own at Least One Pet
- Americans Spent $69.7 Billion on Pet Food and Treats in 2025
How Many Americans have Pets?

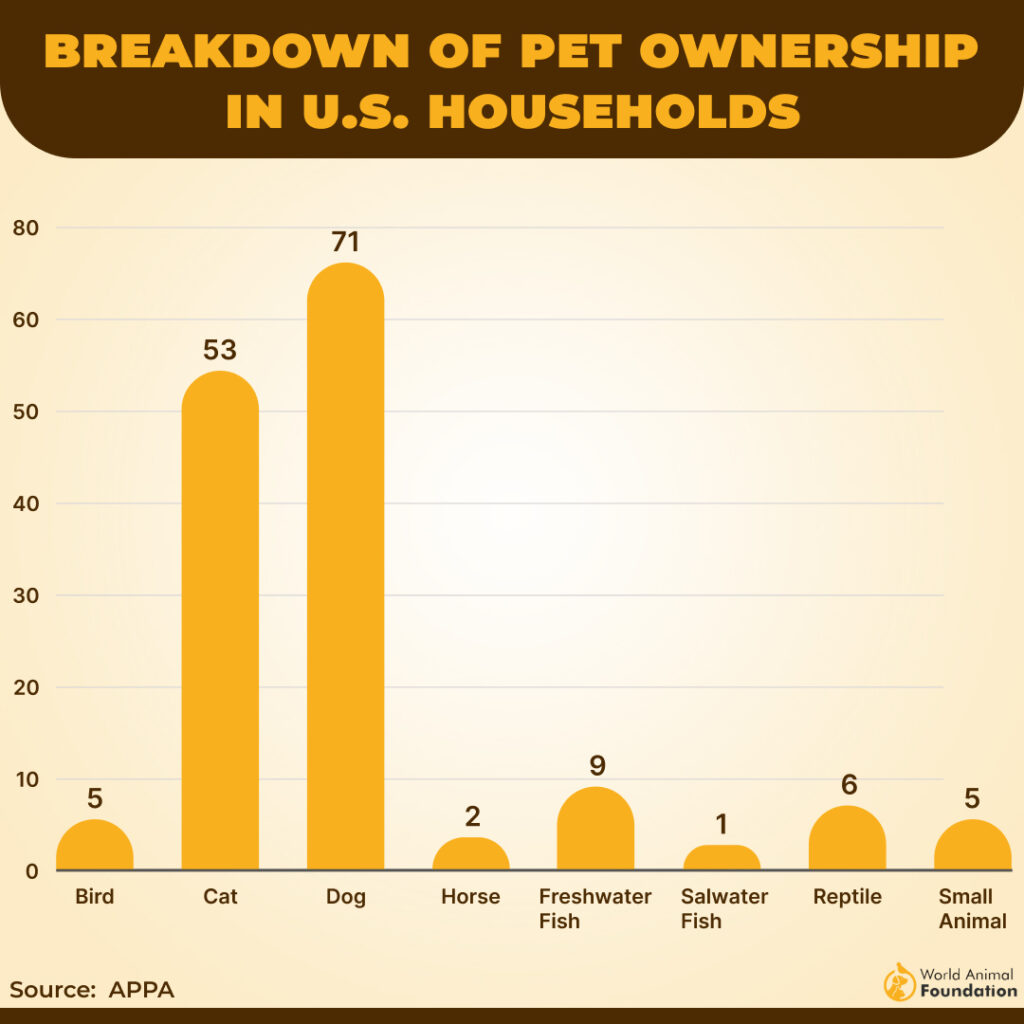
Although there isn’t much information on pet owners, three-quarters of all U.S. households now home a pet. An estimated 71.6 percent of U.S. households, or about 95 million families, own a pet, according to the APPA survey.
According to pet industry statistics, dogs are still the go-to pets for Americans, followed by cat owners, and there is one reptile for every ten dogs.
How Much Do Americans Spend on Their Pets

Pet ownership comes with costs, but that doesn’t mean it’s not attainable for all income levels. Pet spending is approximately ~2-3% of income for Americans.
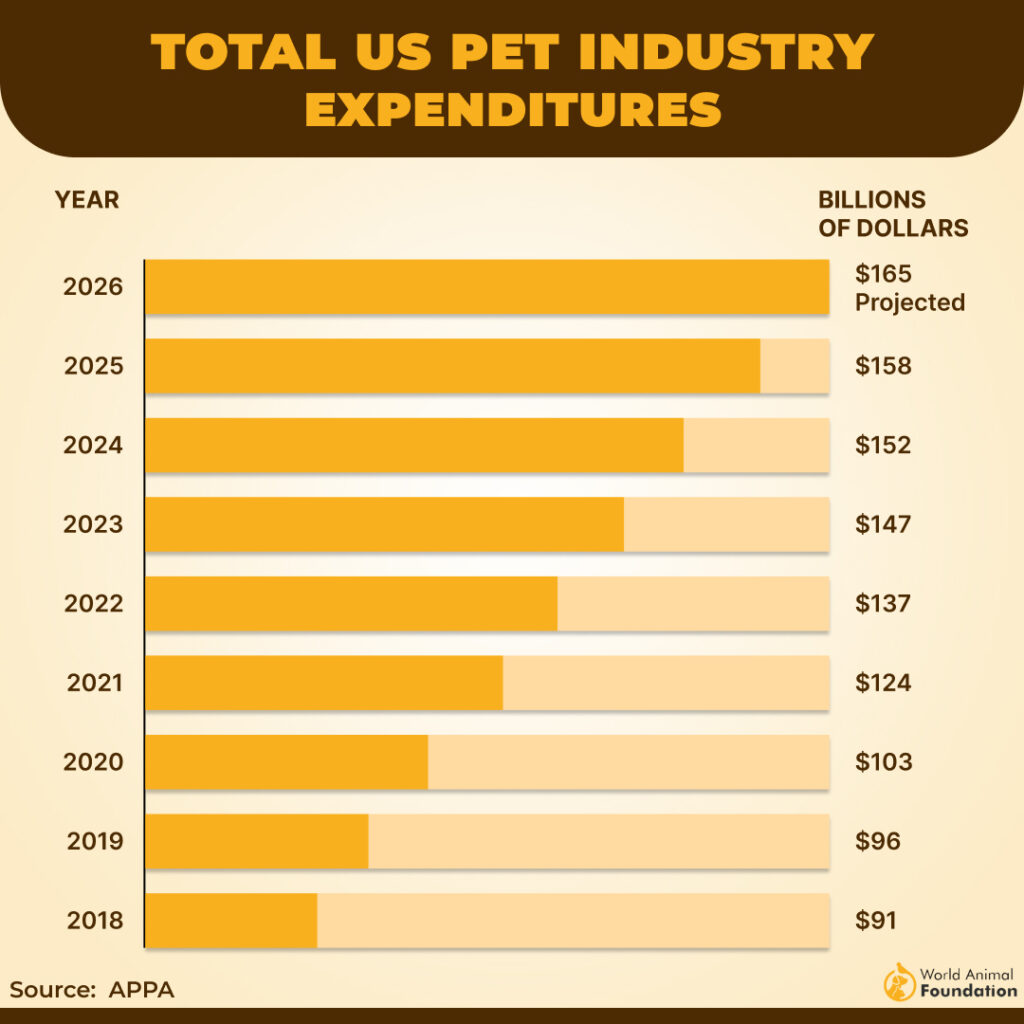
In 2025, U.S. Citizens Spent $158 Billion on Their Pets (APPA)
The latest figures from the APPA (American Pet Products Association) pet owner survey suggest that in 2025, spending in the pet industry reached $158 billion, showing a 3.7% increase. It is expected to grow to $165 billion in 2026. U.S. citizens spent $152 billion on their pets in 2024, and almost $147 billion in 2023.
The year 2026 has started strongly, with overall growth projected at about 4.4%, of which around 2% is due to inflation. Pet spending rose 81% between 2018 and 2026. In the U.S., the pet industry grew from $91 billion in 2018 to $165 billion in 2026, an increase of $74 billion—almost doubling in size.
- Pet Food & Snacks at $68.3 billion (could be why a large portion of dogs are obese)
- Supplies, Live Animals & OTC Medicine $34.4 billion
- Veterinary Care & Product Sales $41.0 billion
- Other Services, like grooming, insurance, pet walking, and daycare at $14.3 billion
Pet Spending in the U.S. Increased from $460 in 2013 to $876 in 2023 (Market Watch Guides)
Although the pandemic drove pet parenting numbers to new heights, it also set new records for how much money we spend annually on our pets. Pet spending in the U.S. increased 61.1% from $460 per year in 2013 to $741 per year in 2022. In 2022, spending on pets reverted to an average of $741, primarily due to reduced expenditures among older generations.
Overall, the average dog owner is spending more on better or premium food, pet supplies, services like dog walking, medical insurance, and veterinary care. We also spend way more time with our pets.
Pet spending has increased due to several factors, with the most significant being a cultural shift in how people view and value pets.
In 2024, about 7.03 million pets were insured in North America—nearly 91% of those pets were in the US. (NAPHIA)
Since 2020, the average annual growth rate of pet insurance enrollment has reached 20%. The U.S. saw a 20.9% increase in total insured pets in 2024 compared to 2023.
For 2023, U.S. pet insurance premiums grew by 25.8% year‑over‑year, with dogs driving the growth, which only makes sense since people spend more on veterinarian dog care than on cats.
According to statistics, 75.6% of dogs are insured compared to 23.5% of cats. Who’s the cat’s meow now?
Almost 70% of Americans aged 50 to 59 own a Pet (NCBI)
In America, it’s called empty nest syndrome once grown children move out. Married couples without children living at home spend more on their pets, while families with young children spend less. Renters owned fewer pets and spent less than homeowners by nearly three times.
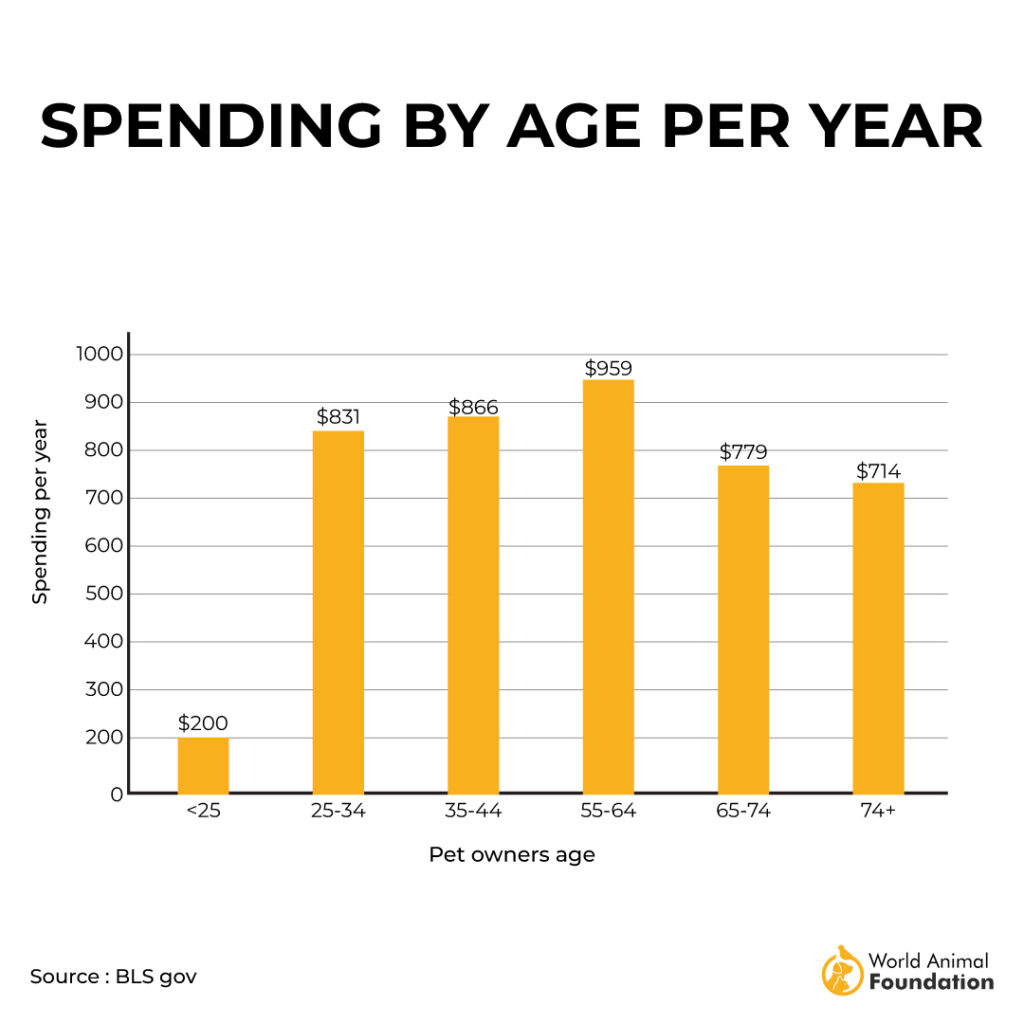
The demographic of middle-aged and older people between 50 and 59 and 60 to 69 spends more than young adults under 25.
Pet Owners Aged 55–64 Spend $959 on Their Pets in 2024. (FRED Data)
Pet owners aged 55-64 spent $959/year on their pets in 2024, with total spending ranging from $766 in 2021 to $1010 in 2020.
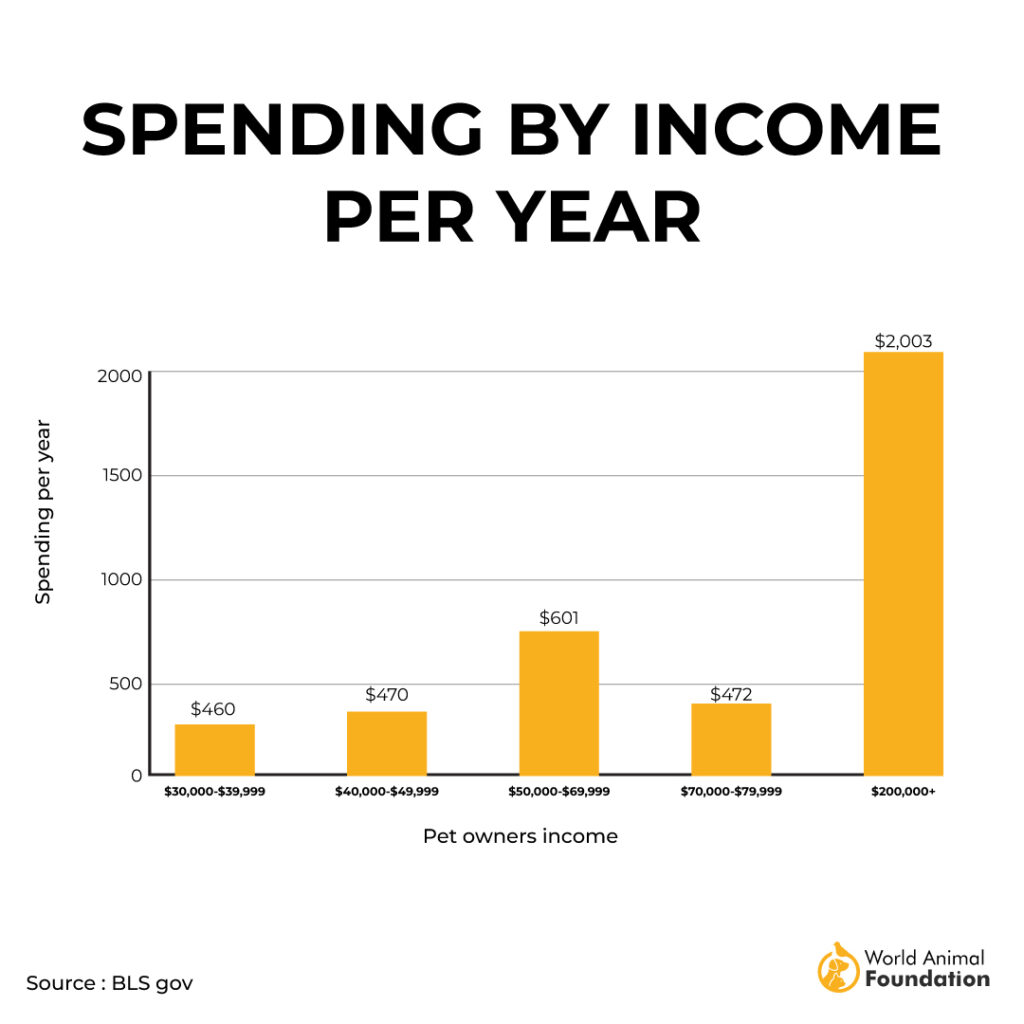
Pet Owners With $200,000+ Income Spend $2,003 on Pets in 2024. (FRED Data)
According to BLS Beta Labs, pet owners earning more than $200,000 income spent $2,003/year on pets in 2024. Even though total spending and average annual income decreased, pet spending habits increased.
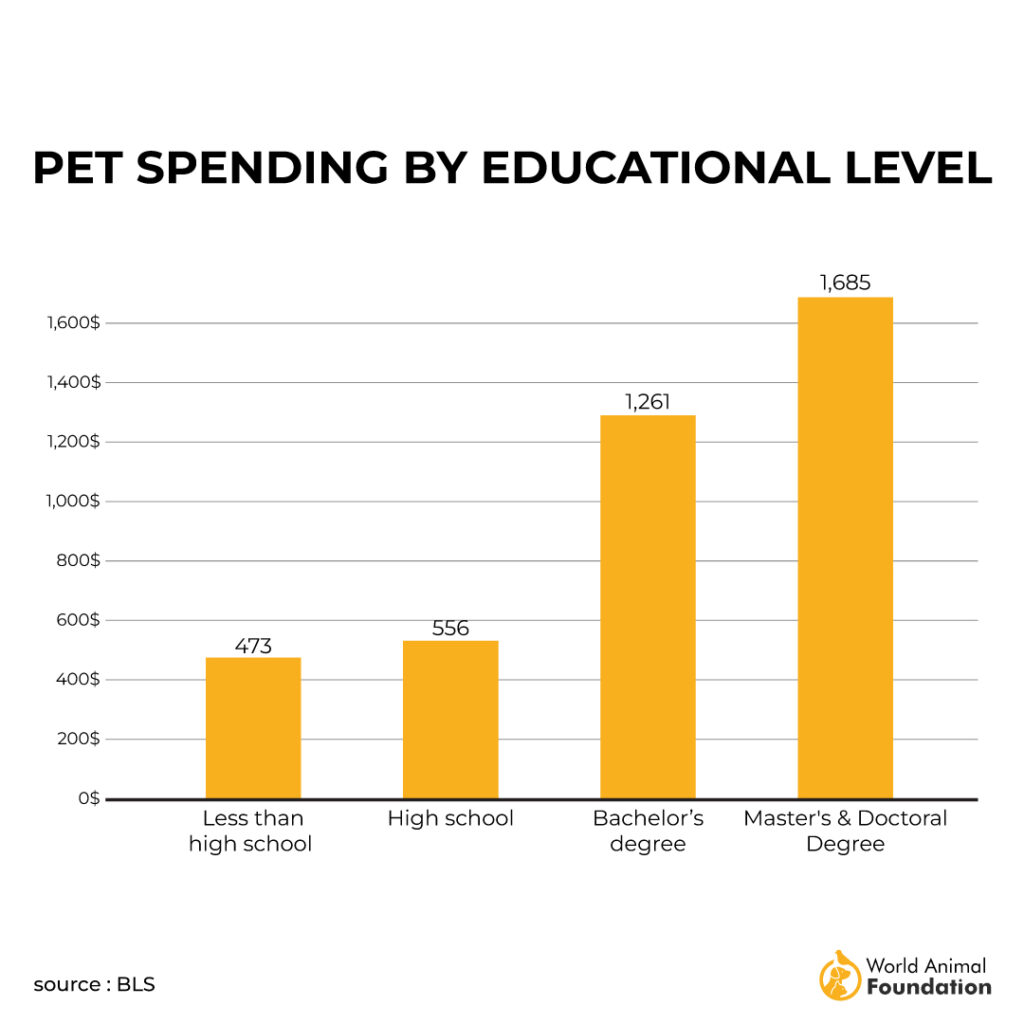
Pet Owners Who Have a Master’s Degree Spend $1,002 on Their Pets. (BLS)
Pet owners with a master’s degree spent $1,002 on their pets in 2022.
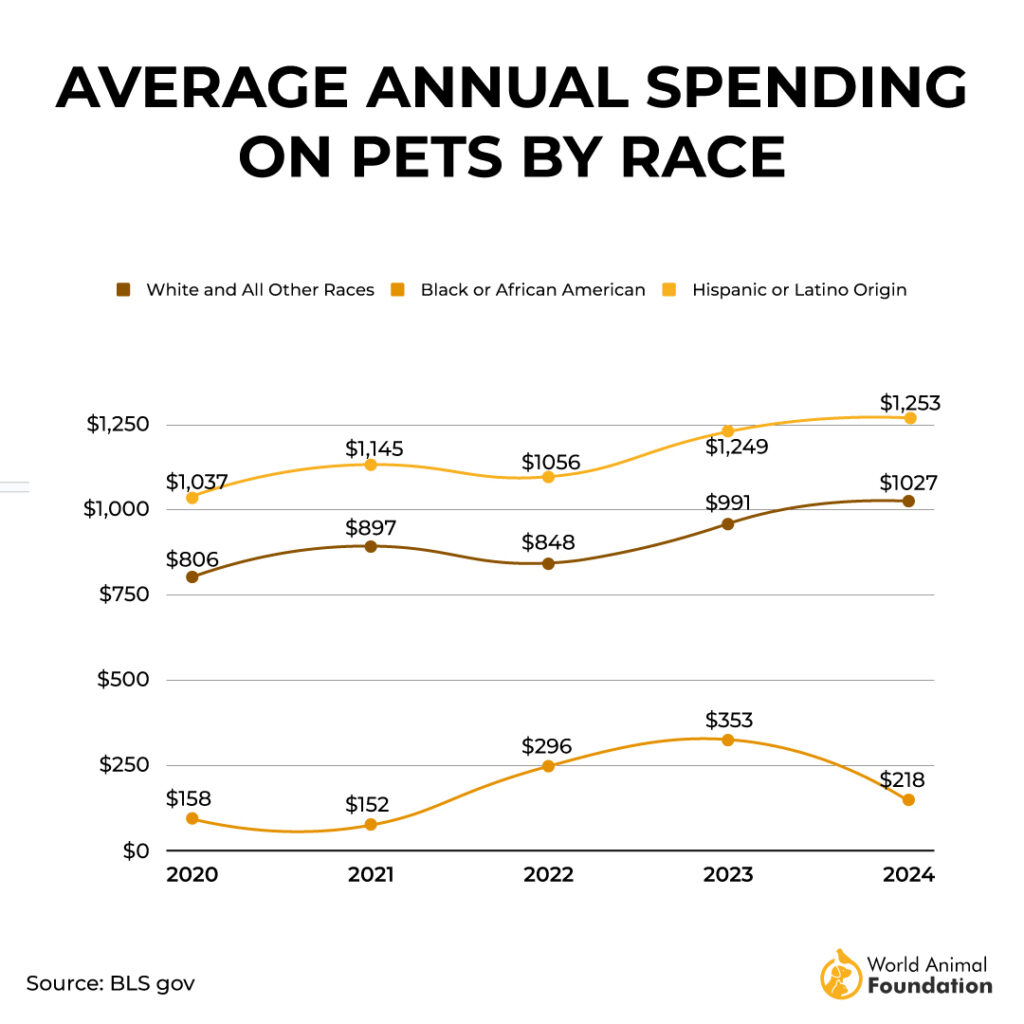
Black Americans spend the Least amount, around $218, on Their Pets (FRED Data)
Black American pet owners spend $218 annually on their pets. Understanding statistics is about something other than numbers. If you interpret the numbers, many black households have a pretax income of $12,500 to $37,000, and many live in and rent apartments.
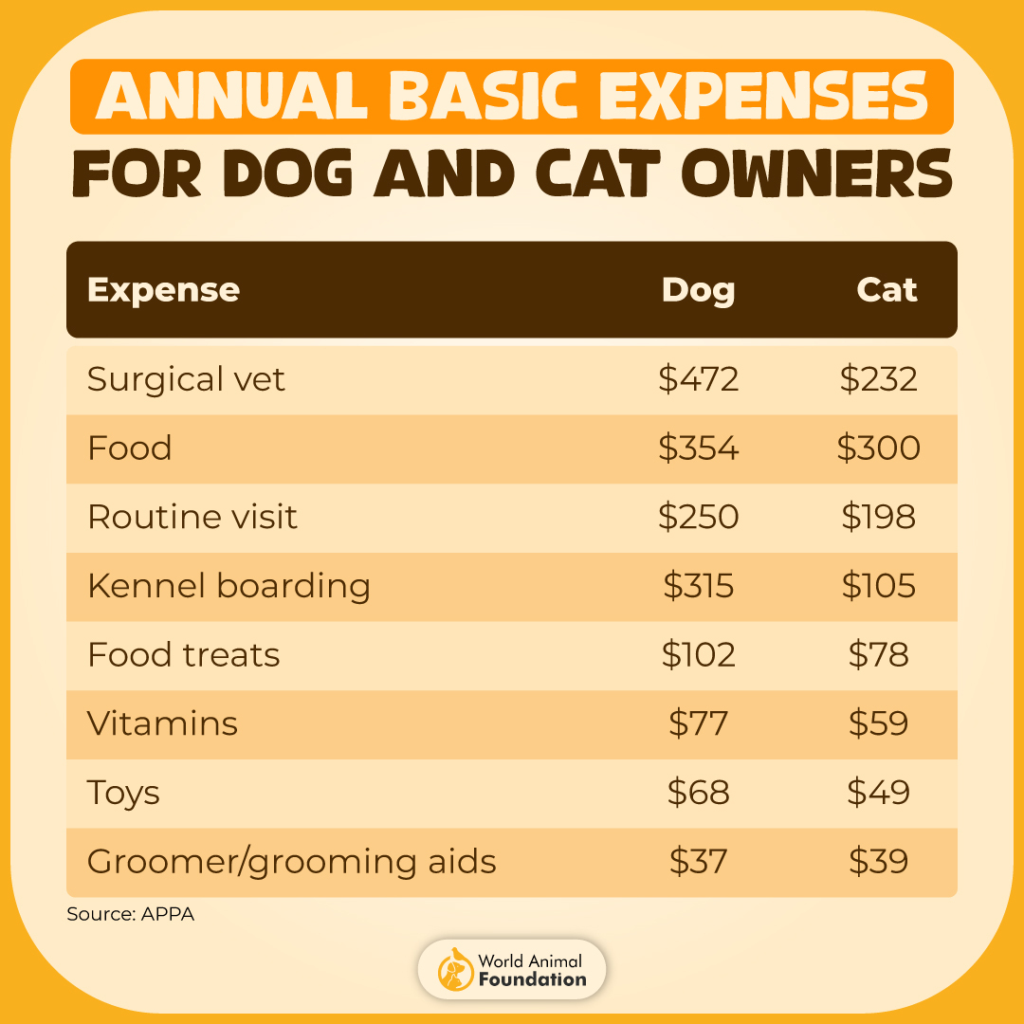
Dog and Cat Expenses

Dog Owners Spent $912, and Cat Owners $653 on Average. (Finmasters)
Annually, dog owners spend $912, and cat owners spend $653 on average. While the love of a pet is immeasurable, the basic annual expenses associated with ownership are significant.
Dogs Cost About $76/Month, and Cats Cost About $54/Month. (Finmasters)
This total amount covers items and services such as food, treats, vet visits, and grooming.
In 2026, Pet insurance costs average about $672/year for dogs and $384/year for cats, based on monthly (Insurify)
Purchasing pet insurance for accidents and illnesses may be worth it, considering the potential costs of medical procedures. On average, it costs $56 per month for dogs and $32 for cats.
Dog Owners Spend an Average of $293 Yearly on Food, Compared to Cat Owners’ $194. (PSS)
American pet food spending for 2025 was a total of $68.3 billion and is projected to reach $69.7 billion in 2026. In 2024, dog owners spent $293/year on food, compared to cat owners at $194/year.
Pet Spending Statistics

The Pet Care Market was worth $273.42 Billion in 2025 and is expected to grow by $289.17 Billion in 2026 (Fortune Business Insights)
This figure is undoubtedly why many industries are compiling pet statistics in an effort to understand the habits of current pet owners and how they spend their money around the world.
The global pet care market was valued at $273.42 billion in 2025 and is expected to grow to $289.17 billion in 2026. The pet care market is still growing as more households own a pet. The pandemic catapulted ownership numbers. People turned to animals to fulfill a need, and we happily pay for a well-done job.
Experts who study trends like the Fortune Business Insights group predict that the animal food industry and the insurance and service providers will drive the category to reach $499.06 billion by 2034.
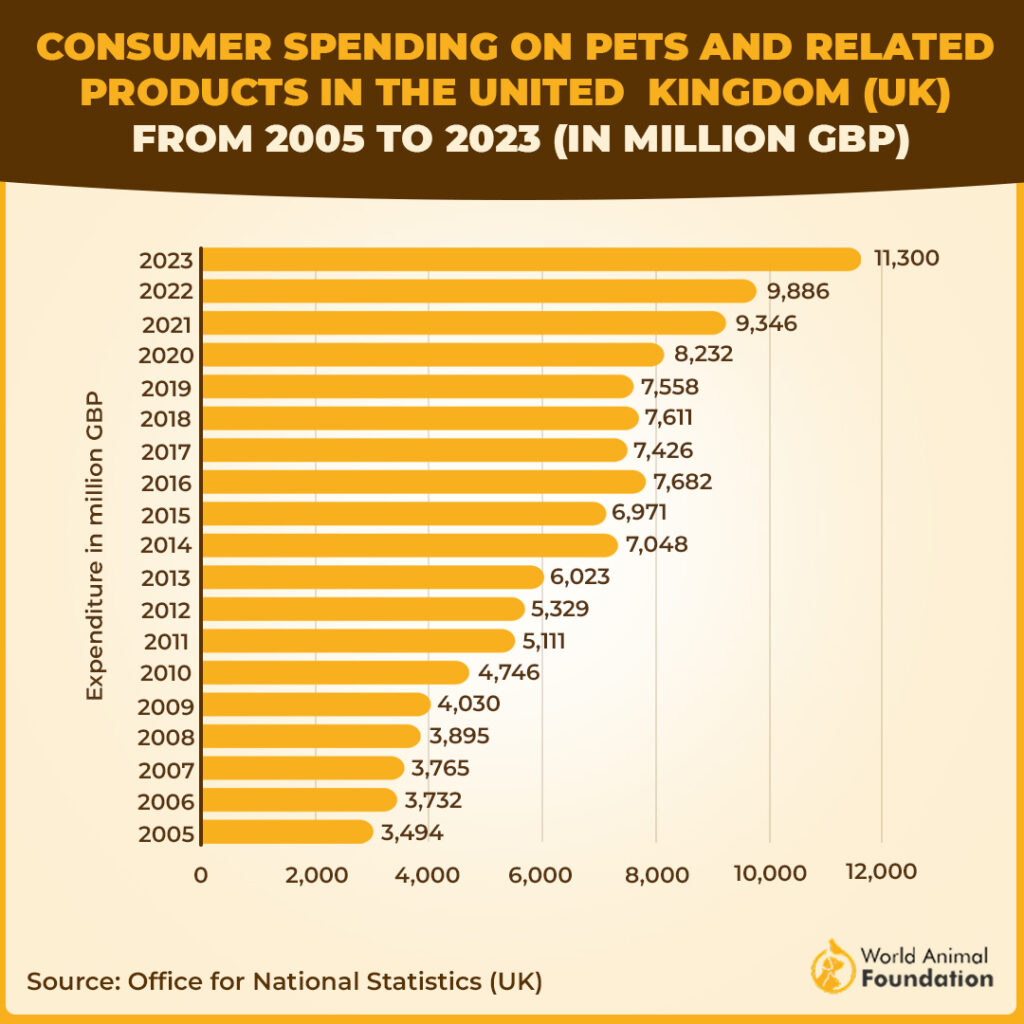
U.K. Pet Owners Spent 9.88 Billion Gbp Annually (Office for National Statistics, U.K.)
Anyone who has ever traveled to the U.K. can attest that Brits take dog ownership seriously.
The pandemic also fueled pet ownership in the U.K. According to pet ownership statistics from the Office of National Statistics, the industry saw an increase of about 23% from 2020 to 2021 to 9.3 billion GBP.
U.K. pet owners spent 9.88 billion pounds in 2022, marking an 182% surge from the start of the survey in 2005. Over the past decade, spending on veterinary services in the UK has soared, notably in 2022, when expenditures on veterinary and other pet care services surpassed £5.3 billion. In 2023, total expenditure was over 7.2 billion British pounds.
The information also revealed that since the beginning of the data available from the ONS survey in 2005, there has been a 270% increase overall. This does not include the significant budget Brits spend on wellies (rubber boots) to walk in the muck next to their canine.
In 2024, Brits Spent 6.3 Billion Pounds on Vet Bills (Vet News and Views)
Prices charged by veterinary practices in the UK rose by approximately 63% between 2016 and 2023. In 2025, an average vet visit costs around £58.29 (increased 8% from 2024); however, that doesn’t include any treatments or surgeries and is separate from other pet spending. U.K. pet owners shelled out £6.3 billion on vet and pet-care services in 2024.
In Canada, the Average Budget for Dog Owners Is Estimated to Be $3,020 (CAD) annually (HelloSafe)
It’s not just American pet owners who invest in pet care and pet services. Canadians increased their pet budgets over four years for all animals, but the average dog and cat owner spends the most at USD 1818.43 annually.
From 2021 to 2024, the yearly cost to own a dog in Canada went up from $2,450 to $3,020. That’s a 23.3% increase in just three years.
Dog owners spend significantly more on their canines than the average cat owner, and budgets reflect that spending. Pet food costs for the largest dog breeds average around $2,640, significantly higher than the $525 spent on food for the smallest breeds.
Overall, food and healthcare remain the two largest expense categories for dog owners.
Pet Parents in Canada Spend Almost $960 per Year on Veterinary Care for Their Dogs and $711 for Their Cats (Safehouse)

Canadians treasure their pets to the tune of over $ 9 billion, pre-pandemic figures. In 2018, Canadians spent $2,075 on their pets, with a 17.1% growth over three years to $2,430. These figures don’t include the additional service fees for dog walkers, pet sitting, daycare, or pet boarding.
Pet Owners in the European Union Spent Around 29.3 Billion Euros on Pet Products and Services in 2023 (FEDIAF)
Did you know that 49% of European households prioritize pet ownership and spend a grand total of €29.3 billion to feed these hungry critters?
The European market has a significant cat population of 108 million, followed by a strong dog contingent of 90 million pet dogs. Further, there are 48 million birds, 25 million small mammals, 18 million aquatic creatures, and 11 million reptiles.
Today, more than 139 million households across Europe enjoy the love and companionship of over 300 million pets. That’s a lot of pets. These household animals contributed to a 9% annual food sales growth.
Chinese Spent ¥330 billion ($41 Billion) in 2024 on Their Pets (CKGSB)
Interestingly, according to the government’s Ministry of Civil Affairs, the ‘singles’ population is now 260 million.
That number is significant because these singles reflect the values of millennials who no longer follow family traditions. Many are opting for pet parenting over traditional family, and 33.7% of singles are pet owners, according to a 2020 Pet Industry Paper. This makes them a pet spending target for the pet industry.
In 2024, urban Chinese pet owners spent more than ¥300 billion ($41 billion) on cats and dogs—up 7.5% year over year—with average annual spending of ¥6,000 per owner, exceeding the total size of China’s health supplement market in 2023. Although foreign pet brands still dominate China’s pet food market, local players are rapidly gaining ground.
Pets are becoming substitutes for relationships and families in a thriving pet consumer market, and pet parents spend willingly and lavishly on their pets. And you can ascertain this trend after learning how much money it costs to own a dog!
Australians Spent A$21.3 billion ($14B/€12B) on their pets in the 12 months to March 2025 (Global Pet Industry)
As of March 2025, Australia’s estimated pet population stands at 31.6 million, with survey data indicating that 7.7 million households currently own a pet.
Although the pandemic was a catalyst, it allowed people the time to invest in a new pet. Australians spend even more than Canadians on dog ownership at A$2,520 ($1,643/€1,413) annually and A$1,656 ($1,094/€929) on felines.
Many people found budgeting and understanding the costs of pet parenting challenging. Dog owners spend twice as much as cat owners based on AMA survey participants.
Who is Spending the Most on Their Pets

30% of Millennials Own at Least One Pet (APPA)
According to the American Pet Products Association survey, 30% of millennials own at least one pet. Millennials view pets, especially dogs and cats, as integral members of their family.
Dogs Influenced 42% of Millennial First-Home Purchases. (Forbes)
Thirty-three percent of first-time millennial homeowners cited the desire for improved space or a yard for their dog as a factor influencing their decision to purchase a home.
47% of Gen Z pet owners spend on pets for social media posts. (AAHA)
The pet spending demographics show that a significant number of pet owners prioritize showcasing their pets online, with 28% making special purchases specifically for posting about their pets on social media platforms overall.
The younger the pet owner, the more likely they are to spend money on social media. 47% of Gen Z pet owners spend on pets for social media posts.
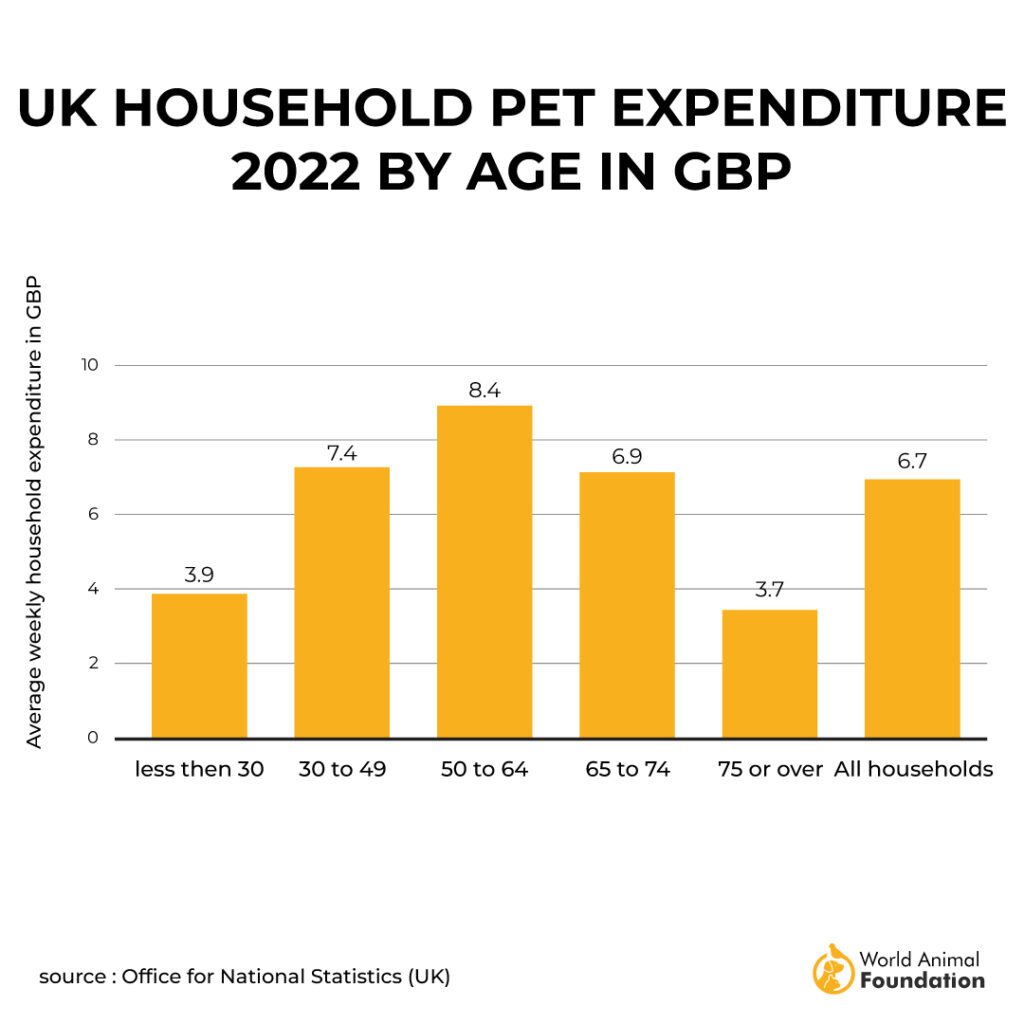
U.K. Adults Age 50-64 Spend the Most on Their Pets (Statista)
Economic times are tough for Brits now; they’re amidst a financial meltdown and increasing inflation and cost of goods. The average household of 50 to 64-year-olds still spent £8.4 on food and other expenses.
The 75-year-old and older senior group spent £3.70 per week. While younger generations, 30 and under, paid £3.90.
Americans between 35 and 44 Years Spend Almost $107.85 per Month on Their Pet (OppLoans)

In a recent OPPLoans survey, it was revealed that the 35-40-year-old age group spends $107.85 a month on their favorite pet. One in five admitted they spend more than they earn.
Survey data shows that millennials aged 18–24 spend the most on their pets, averaging US$173.67, followed by pet owners aged 25–34 with an average spend of US$141.50.
The New Pet Owners in the U.K. Are Between 16-34 Years Old (PFMA)

The U.K. has always been a pet-loving nation and is the first to recognize animals as sentient beings. Approximately 12.5 million cats and dogs live in almost 13.5 million British households, and 3.2 million of those found homes during the pandemic. Gen Z and Millennials (aged 16-34) made up 59% of new pet owners.
By 2024, millennials and Gen Z (post-90s and post-00s) accounted for about 60% of pet owners in China. (Daxue Consulting)
China’s pet market is expanding faster than its pet population, signaling a steady increase in spending per pet. Notably, post-00s have emerged as a major growth driver, with pet ownership in this group rising 39.5% year over year.
What Do Pet Owners Spend the Most Money On

Total U.S. pet industry expenditure reached $158 billion in 2025 and is projected to climb to $165 billion in 2026. (APPA)
The pet industry continues to show strong growth and resilience, with sales projections to reach $165 billion in 2026. Additionally, 77% of U.S. pet owners report that the current economy has not impacted their pet ownership.
Americans spent $68.3 billion on Pet Food and Treats in 2025 (APPA)
The Pet Food Industry is growing, and over $68.3 billion in food and pet snack sales from U.S. pet households have been recorded. For comparison, Americans spent $65.8 billion on pet food and treats in 2024.
Americans Splurge $27 Billion and $4.8 Billion to Buy Candy and Jewelry as Valentine’s Gifts for Their Pets (NRF)

A record-breaking 32% plan to include their beloved pets in their Valentine’s Day celebrations, with an average spending of $5.28 each, totaling a substantial $703 million on various small gifts.
53.2% plan to buy candy for their pets.
45% of the Pet Owners Spent the Same on the Pets’ Health as They Spent on Themselves. (LendEDU)
Some possible explanations for this trend may involve individuals prioritizing their pets‘ health and dental appointments over their own or possibly neglecting their own health needs in favor of caring for their pets.
Pet Industry Worth
- The U.S. pet care e‑commerce market reached $24.17B in 2024, continuing its upward trajectory from 2023. The global pet care e‑commerce market is projected to reach $54.48 billion by 2034.
- The U.S. pet insurance market reached $4.7 billion in total premium volume at year‑end 2024, reflecting a 21.4% year‑over‑year increase.
- The dog walking services industry has been growing at about 9% per year since 2020, and by 2025, it’s expected to generate $1.3 billion in revenue.
- Global pet clothing is projected to grow from USD 6.05 billion in 2025 and reach USD 10.34 billion by 2034.
- The pet industry in Latin America crossed $10.7 billion in 2023. The pet care market is projected to reach US$18.1 billion by 2032, with a growth rate (CAGR) of 6.03% during 2024-2032.
- The Latin American pet care market size was valued at USD 11.38 billion in 2024. Looking forward, IMARC Group estimates the market to reach USD 18.88 billion by 2033, exhibiting a CAGR of 5.79% from 2025 to 2033.
FAQs
What Demographic Spends the Most Money?
Despite millennials being stereotyped as pet-obsessed, BLS data reveal that they spend less on their pets annually compared to Generation X and boomers. While Generation X spends the most in total, they allocate the least proportion of their income. Conversely, Baby Boomers spend the most relative to their income, despite economic uncertainty.
What Is the Most Popular Pet in the United States?
According to the APPA, dogs are the most popular pets in the U.S., with 68 million households owning a dog, followed by cats (49 million households) and freshwater fish (10 million households).
What Is the Average Monthly Cost for a Dog?
The monthly cost of owning a dog can vary significantly, ranging from $40 to $290. For a more personalized estimate, you can use our cost of owning a dog calculator to assess the specific expenses associated with dog ownership.
How Much Does a Dog Cost?
For new dog owners, upfront costs can vary from $1,144 to $5,360. Annual expenses for basic essentials range from $560 to $3,860. Additionally, optional extras for most dog parents can cost between $500 and $5,000 per year.
How Many Pets Are There?
It’s estimated that there are over a billion pets worldwide, with families in the U.S., Brazil, the EU, and China accounting for over half a billion dogs and cats combined. Moreover, more than half of the world’s population is believed to have a pet at home.
How Many People Own a Dog?
According to Statista, dogs emerged as the most popular pet worldwide, with over 470 million kept as pets globally. During the same period, there were approximately 370 million pet cats worldwide.
Wrap Up
Owning a pet is a privilege and not a right. However, that doesn’t mean that only wealthy households can be pet parents. Dogs, cats, and other pet animals require shelter, food, protection, vet care, and oodles of love.
The pet premium food industry sees enormous opportunities in increasing gourmet food sales and designer pet garments, and the pet insurance market is still severely underdeveloped in most countries and for most pets.
Understanding which households own a pet and pet spending statistics, as well as pet owners’ habits, are vehicles to drive growth.
This entire article was written while throwing a ball for one smart dog! 😊